
Hertz
Turning Fragmented Driver Operations into a Manageable System
Role Product Designer UX Researcher
Timeline December 2024 - November 2025
Overview
This project focused on designing an internal portal to support the management of hourly rideshare drivers operating company-owned vehicles at Hertz. Drivers would clock in, take a vehicle from the fleet, and complete scheduled shifts in designated areas.
The business was built around utilizing surplus vehicles from the rental fleet, by employing drivers on hourly shifts. While this created a new revenue stream, it also introduced the need to manage a workforce across multiple locations without existing operational infrastructure.
At the start of the project, managers relied on spreadsheets, email, and manual coordination for onboarding, scheduling, attendance, and performance tracking. As a result:
Onboarding was split across HR and location managers with no centralized tracking
Scheduling was managed manually with limited visibility into constraints
Employee performance data was difficult to access and act on
Attendance and shift activity were inconsistently tracked
Managers lacked a clear way to identify high- and low-performing drivers
These processes were manageable at a small scale but would not support planned expansion to additional locations.
The goal of the portal was to centralize these workflows, improve visibility, and provide a system that could scale with the business.
Discovery & Research
Initial discovery focused on understanding how different stakeholders were managing their workflows.
Conversations were held with location managers, operations managers, and HR staff to map current workflows
Pain points were identified around fragmented information, manual coordination, and lack of visibility
A design workshop was conducted using personas to simulate key tasks and identify gaps in the current process
Ongoing input was gathered through collaboration with the project manager, who regularly met with stakeholders and provided updates on evolving business needs.
The primary insight was consistent across users: information existed, but it was scattered and difficult to act on.
These processes were manageable at a small scale but would not support planned expansion to additional locations.
The goal of the portal was to centralize these workflows, improve visibility, and provide a system that could scale with the business.
Design Approach
Information architecture foundation
The primary challenge was organizing a large volume of interconnected data into a structure that reflected stakeholder priority and task cohesion.
This included:
Defining top-level navigation across onboarding, scheduling, performance, and fleet
Establishing consistent UI patterns for tables, filters, and detail views
Ensuring that key information could be accessed quickly without overwhelming the user
Building out complexity
The system was intentionally developed in stages, starting with foundational views that displayed static information before moving into more complex, interactive workflows.
Early sections such as the location directory, driver directory, and onboarding tracking were used to:
Establish core UI patterns (Material Design 3 components were used whenever possible)
Define data structures
Validate navigation and hierarchy
These initial areas provided a stable foundation before introducing more complex functionality.
Designing for connected workflows
Because onboarding, scheduling, performance, and fleet management were tightly linked, design decisions were made with system-level consistency in mind.
Shared components were reused across different sections
Interaction patterns were standardized to reduce learning overhead
Data relationships were surfaced in ways that supported decision-making
The goal was to create a system where managers could move between workflows without needing to relearn how the interface worked, while still supporting the complexity of the underlying operations.
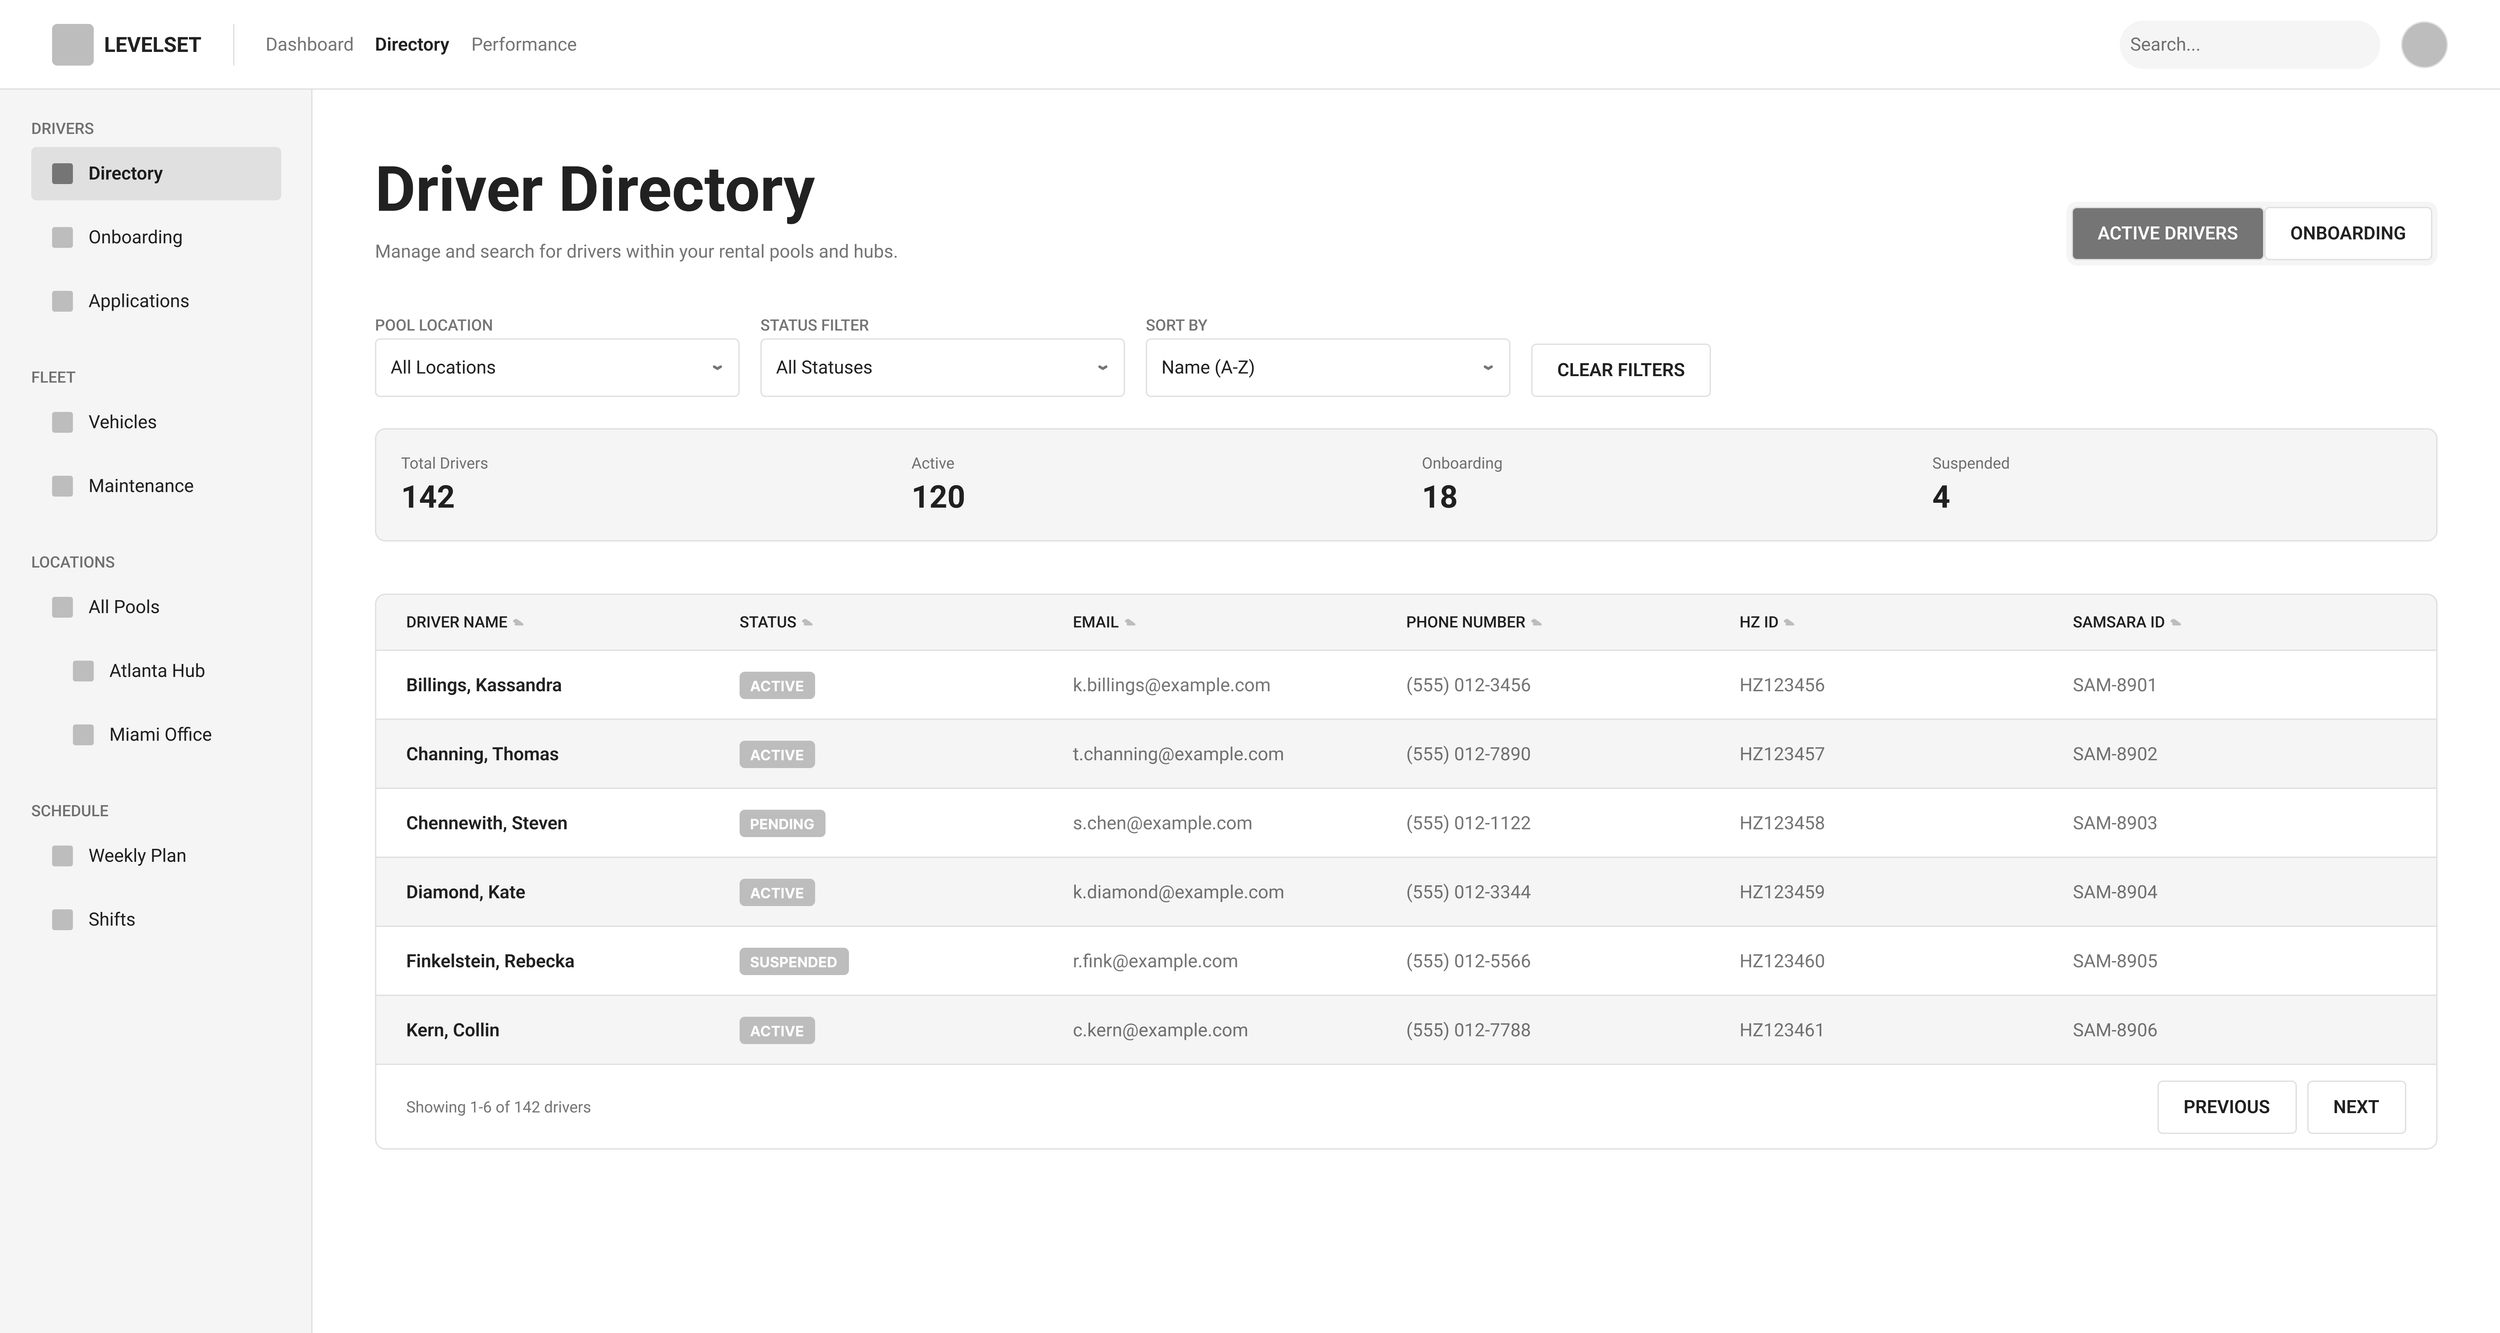
Early AI Wireframe Drafting
Around this time our team started integrating AI wireframe generating into our workflows. We used Figma’s AI tools and UX Pilot to help throughout the design process, especially in the early stages of ideation to help get a strong base to work off of.
Driver Directory
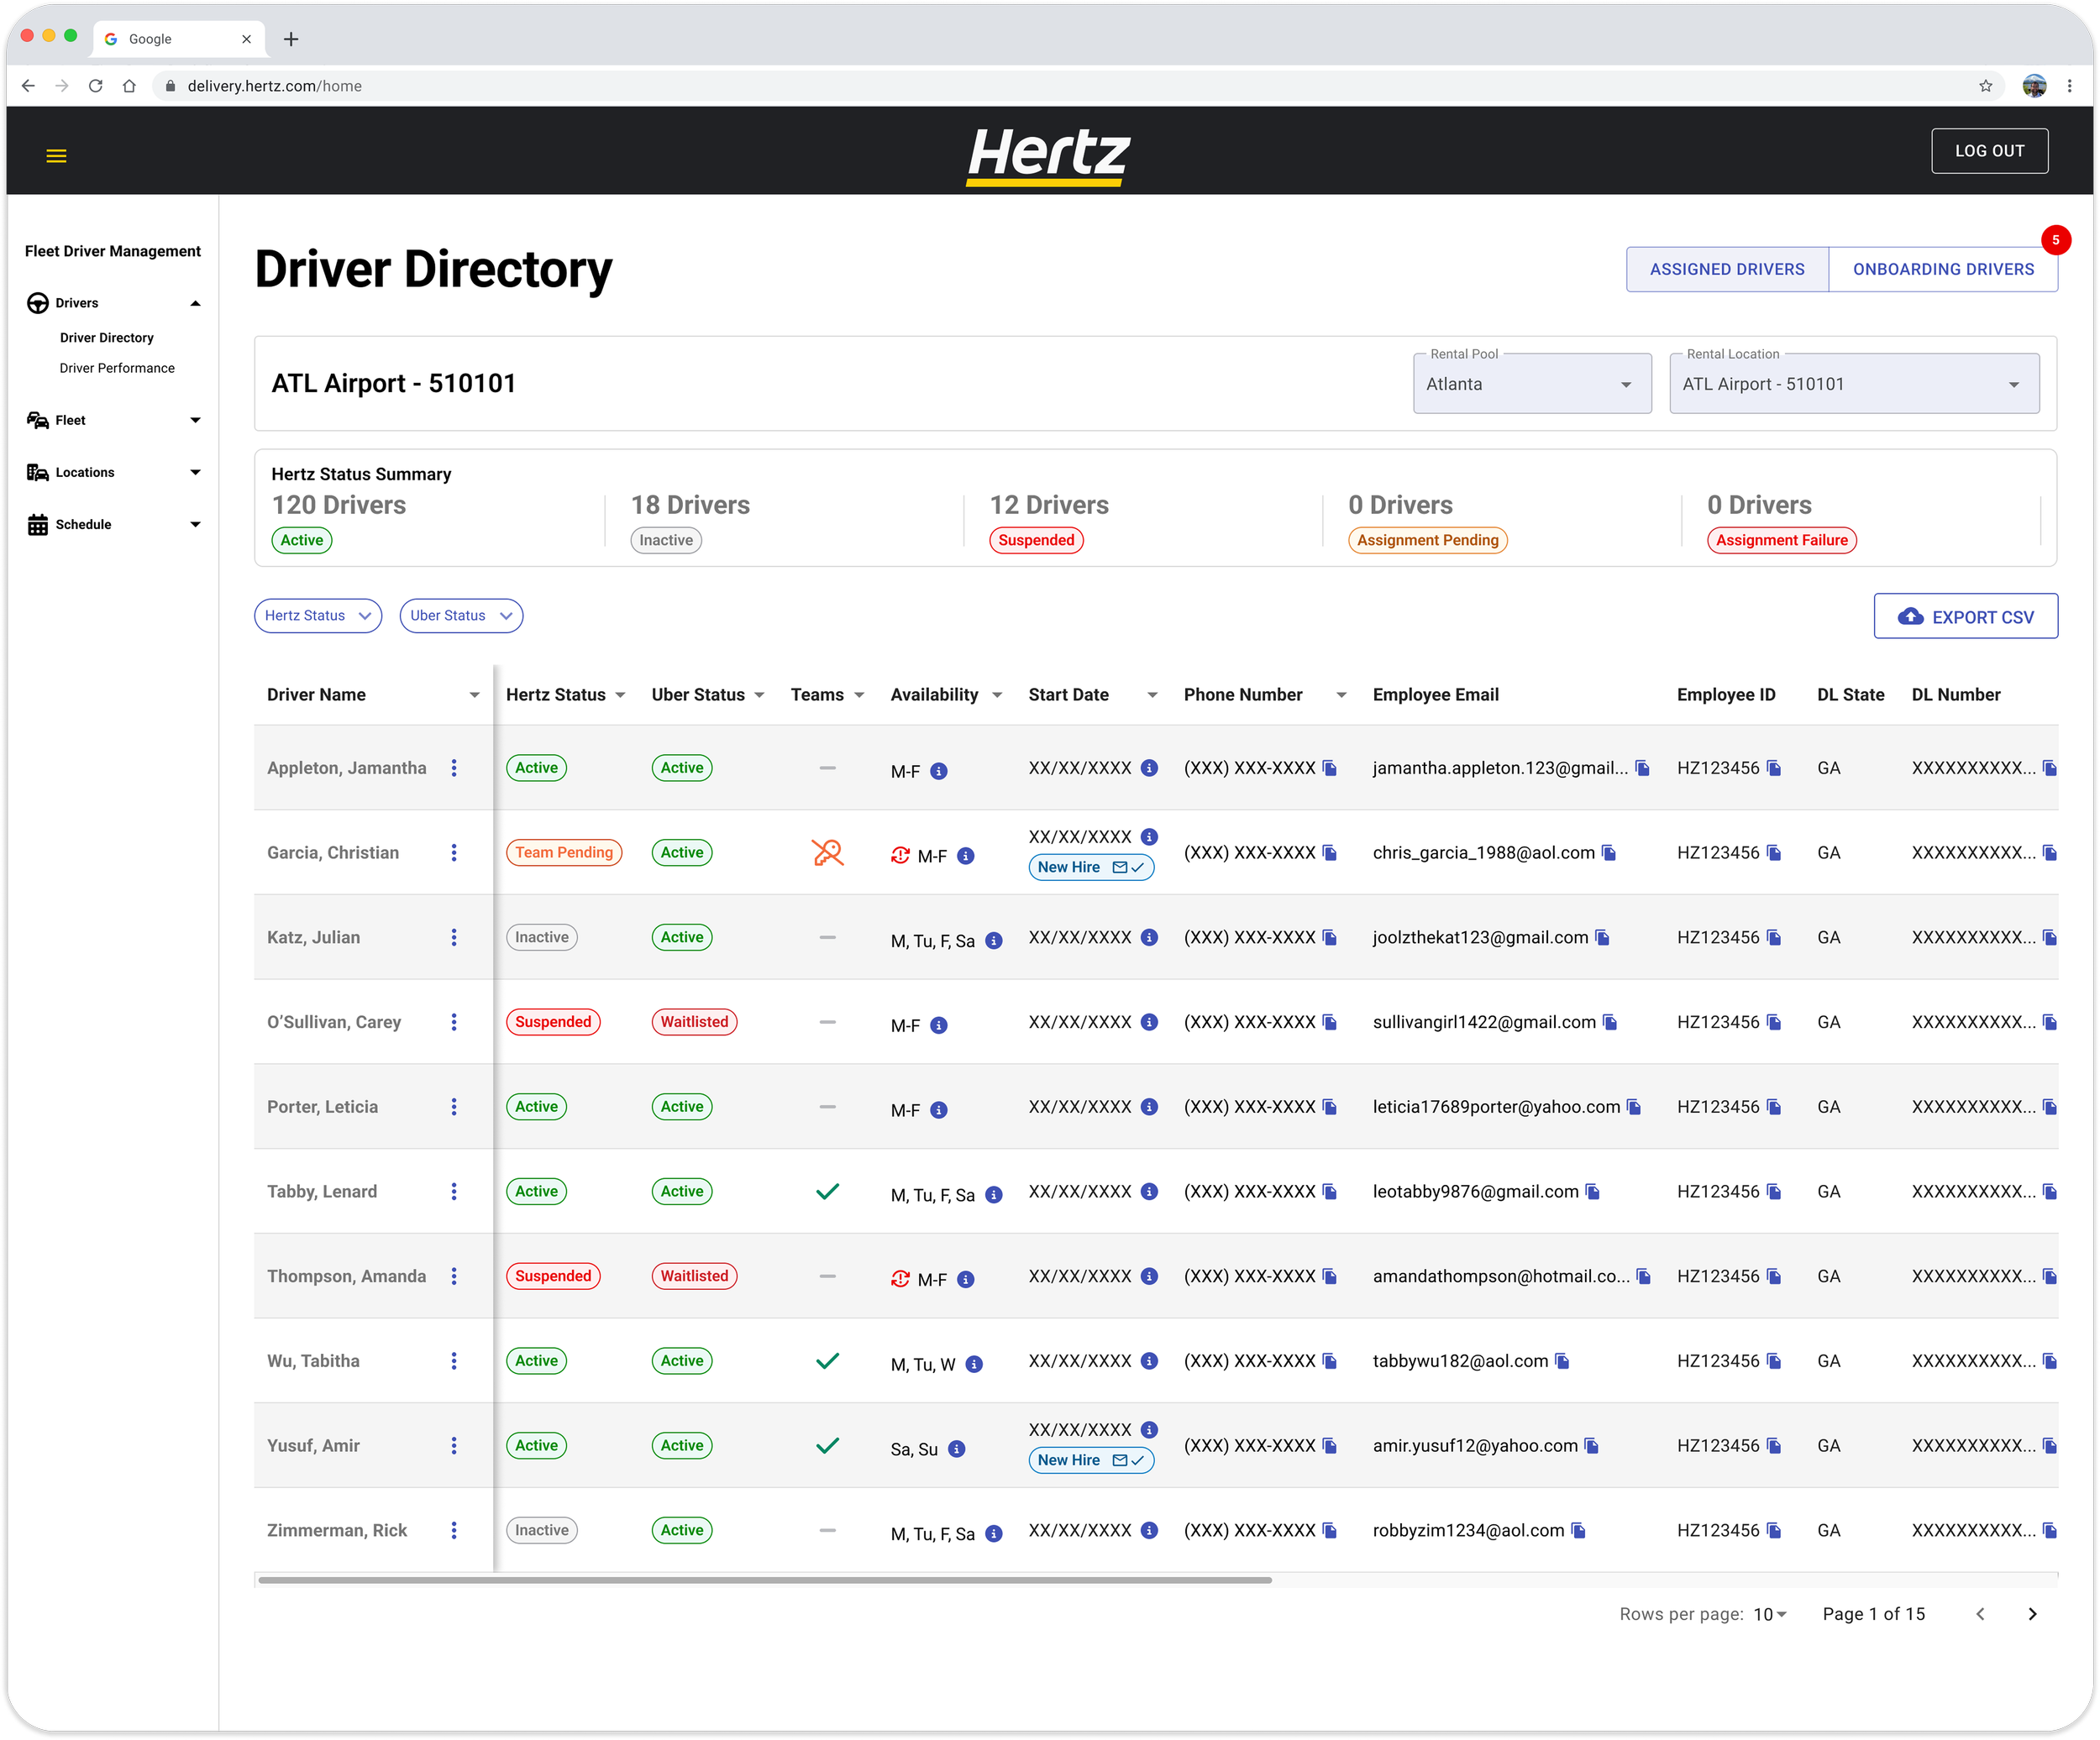
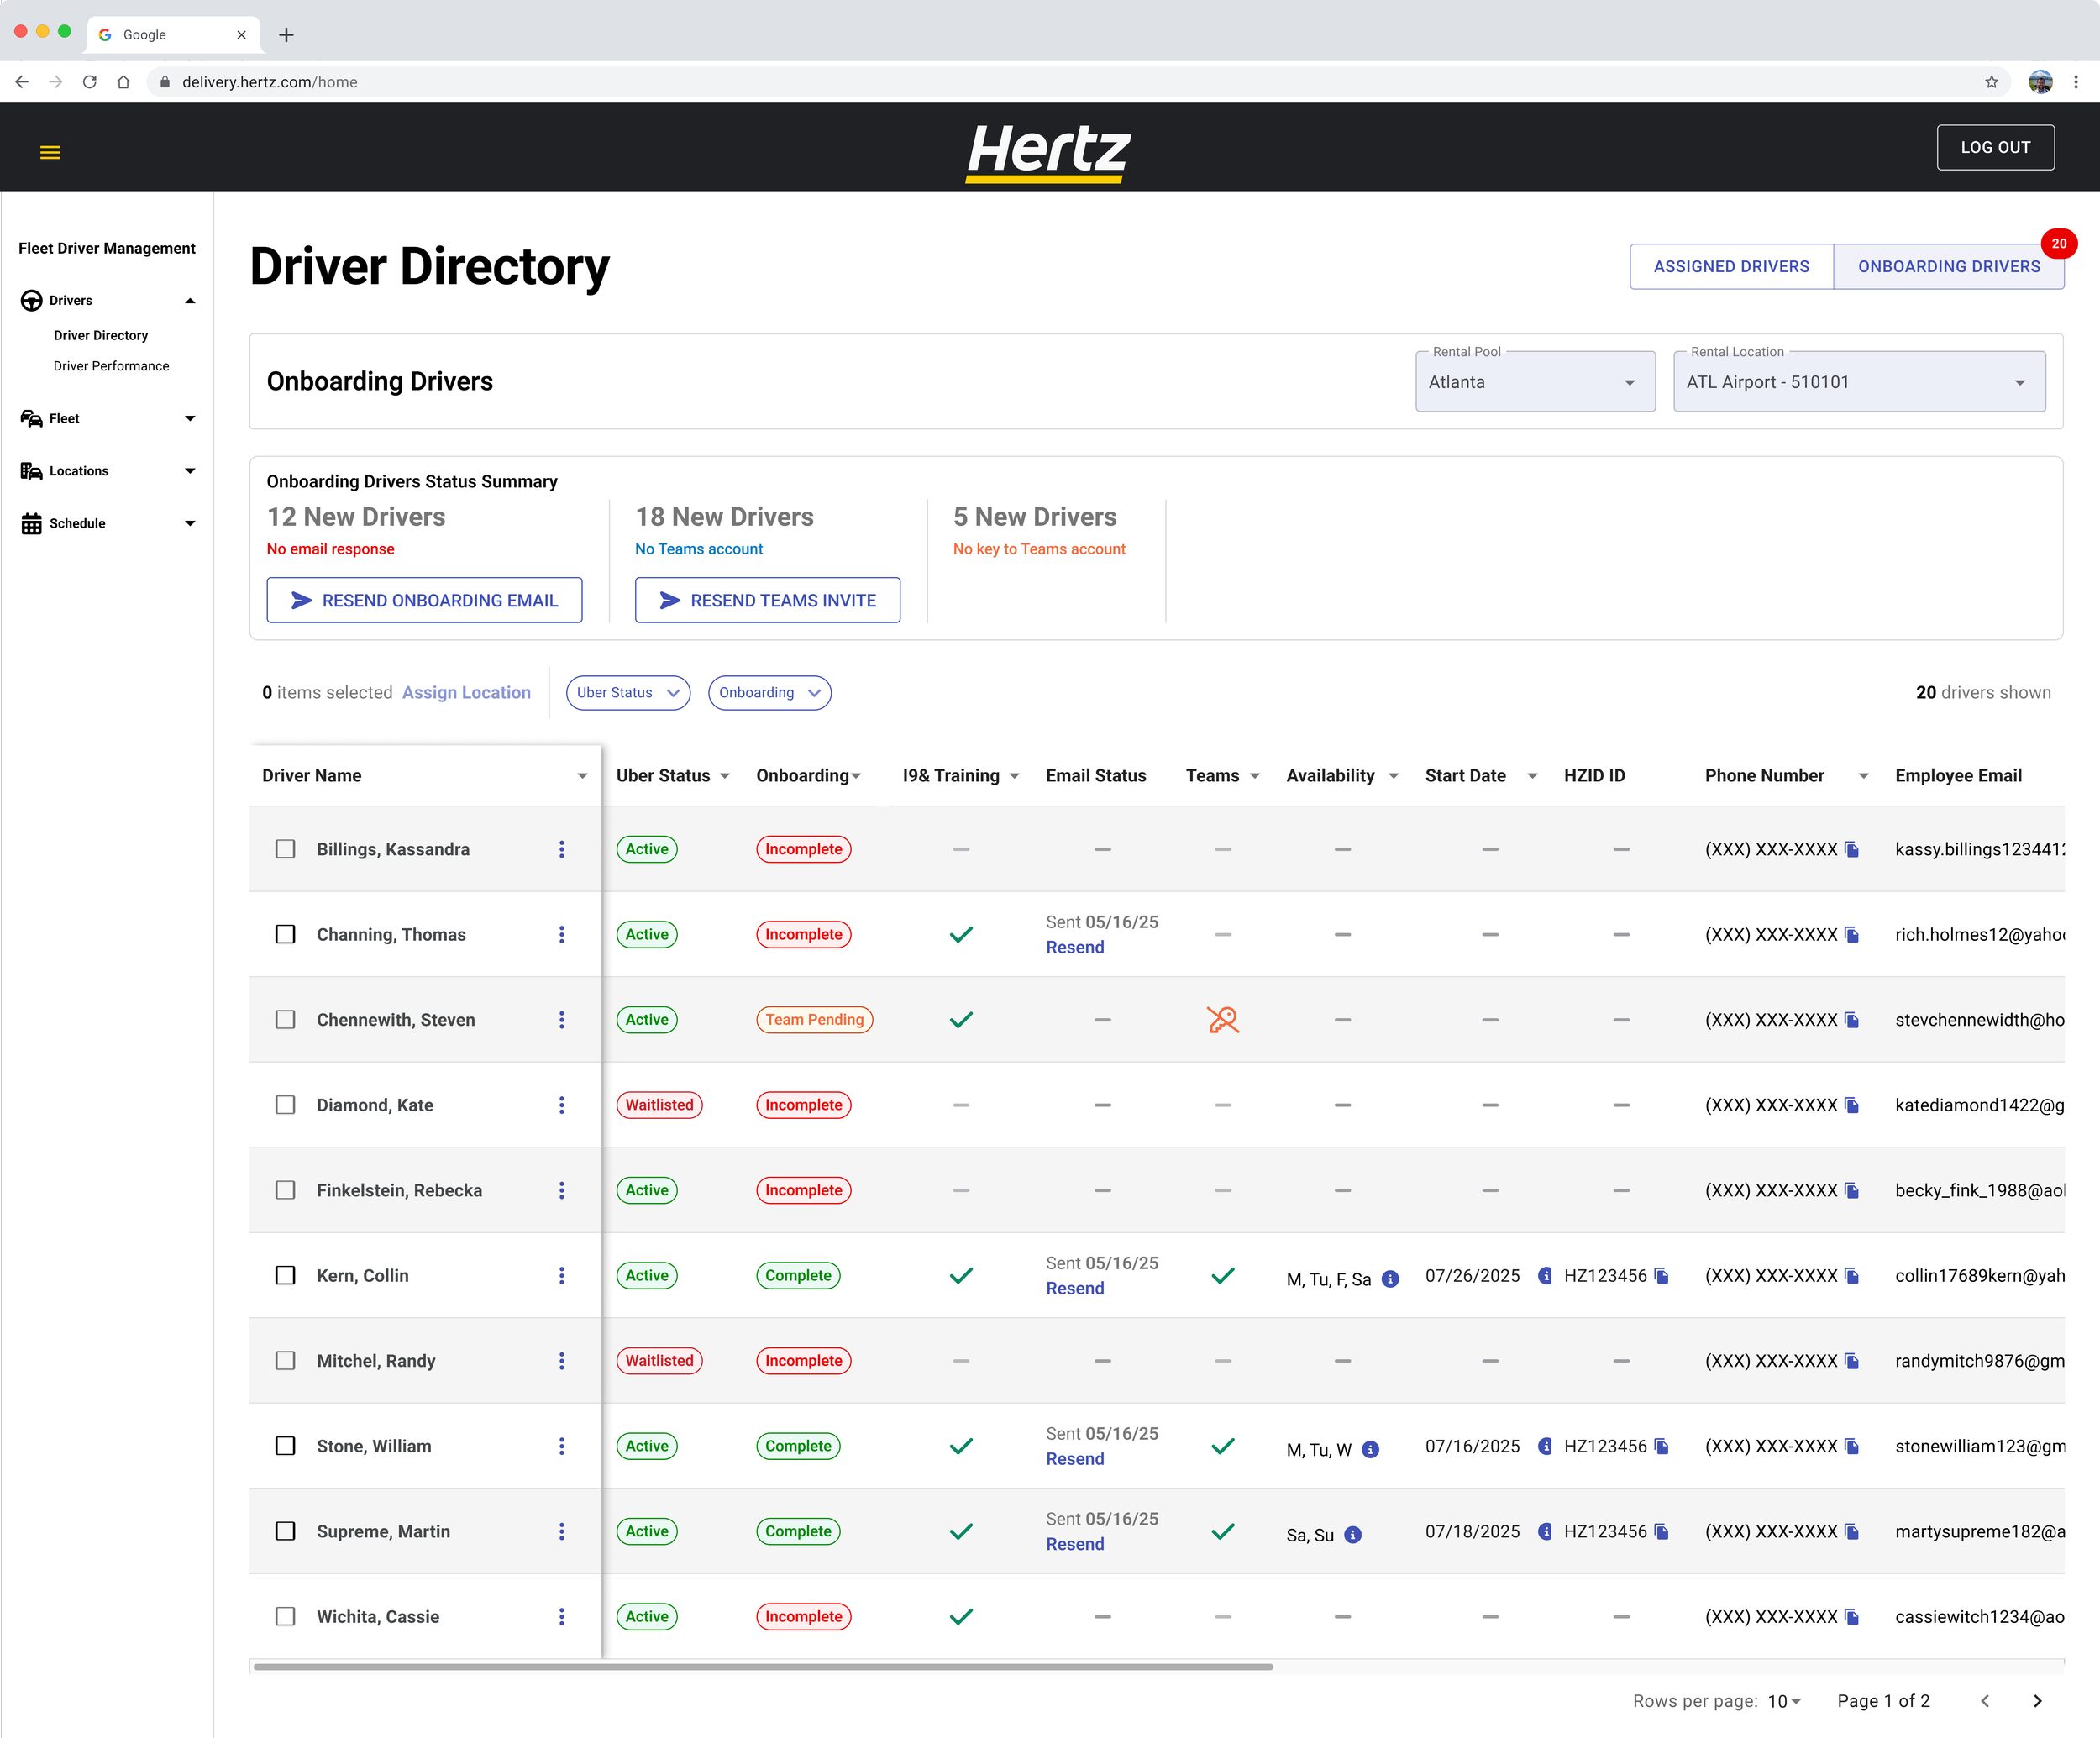
The Driver Directory served as the central source of employee information. functioning as both a traditional employee directory and the primary tool for monitoring onboarding progress, tracking driver status, and managing location assignments.
Active Driver Visibility
The active driver view gave managers a complete picture of employees at a selected location. Managers could search and filter drivers by status, then view information such as:
Uber status (reflected driving and rider performance)
Hertz status (reflected attendance and internal expectations)
Basic employee profile information
Driver licensing details
Notes for tracking manager interventions
Bringing this information into a single view reduced the need to move between spreadsheets and other systems.
Reducing Administrative Overhead
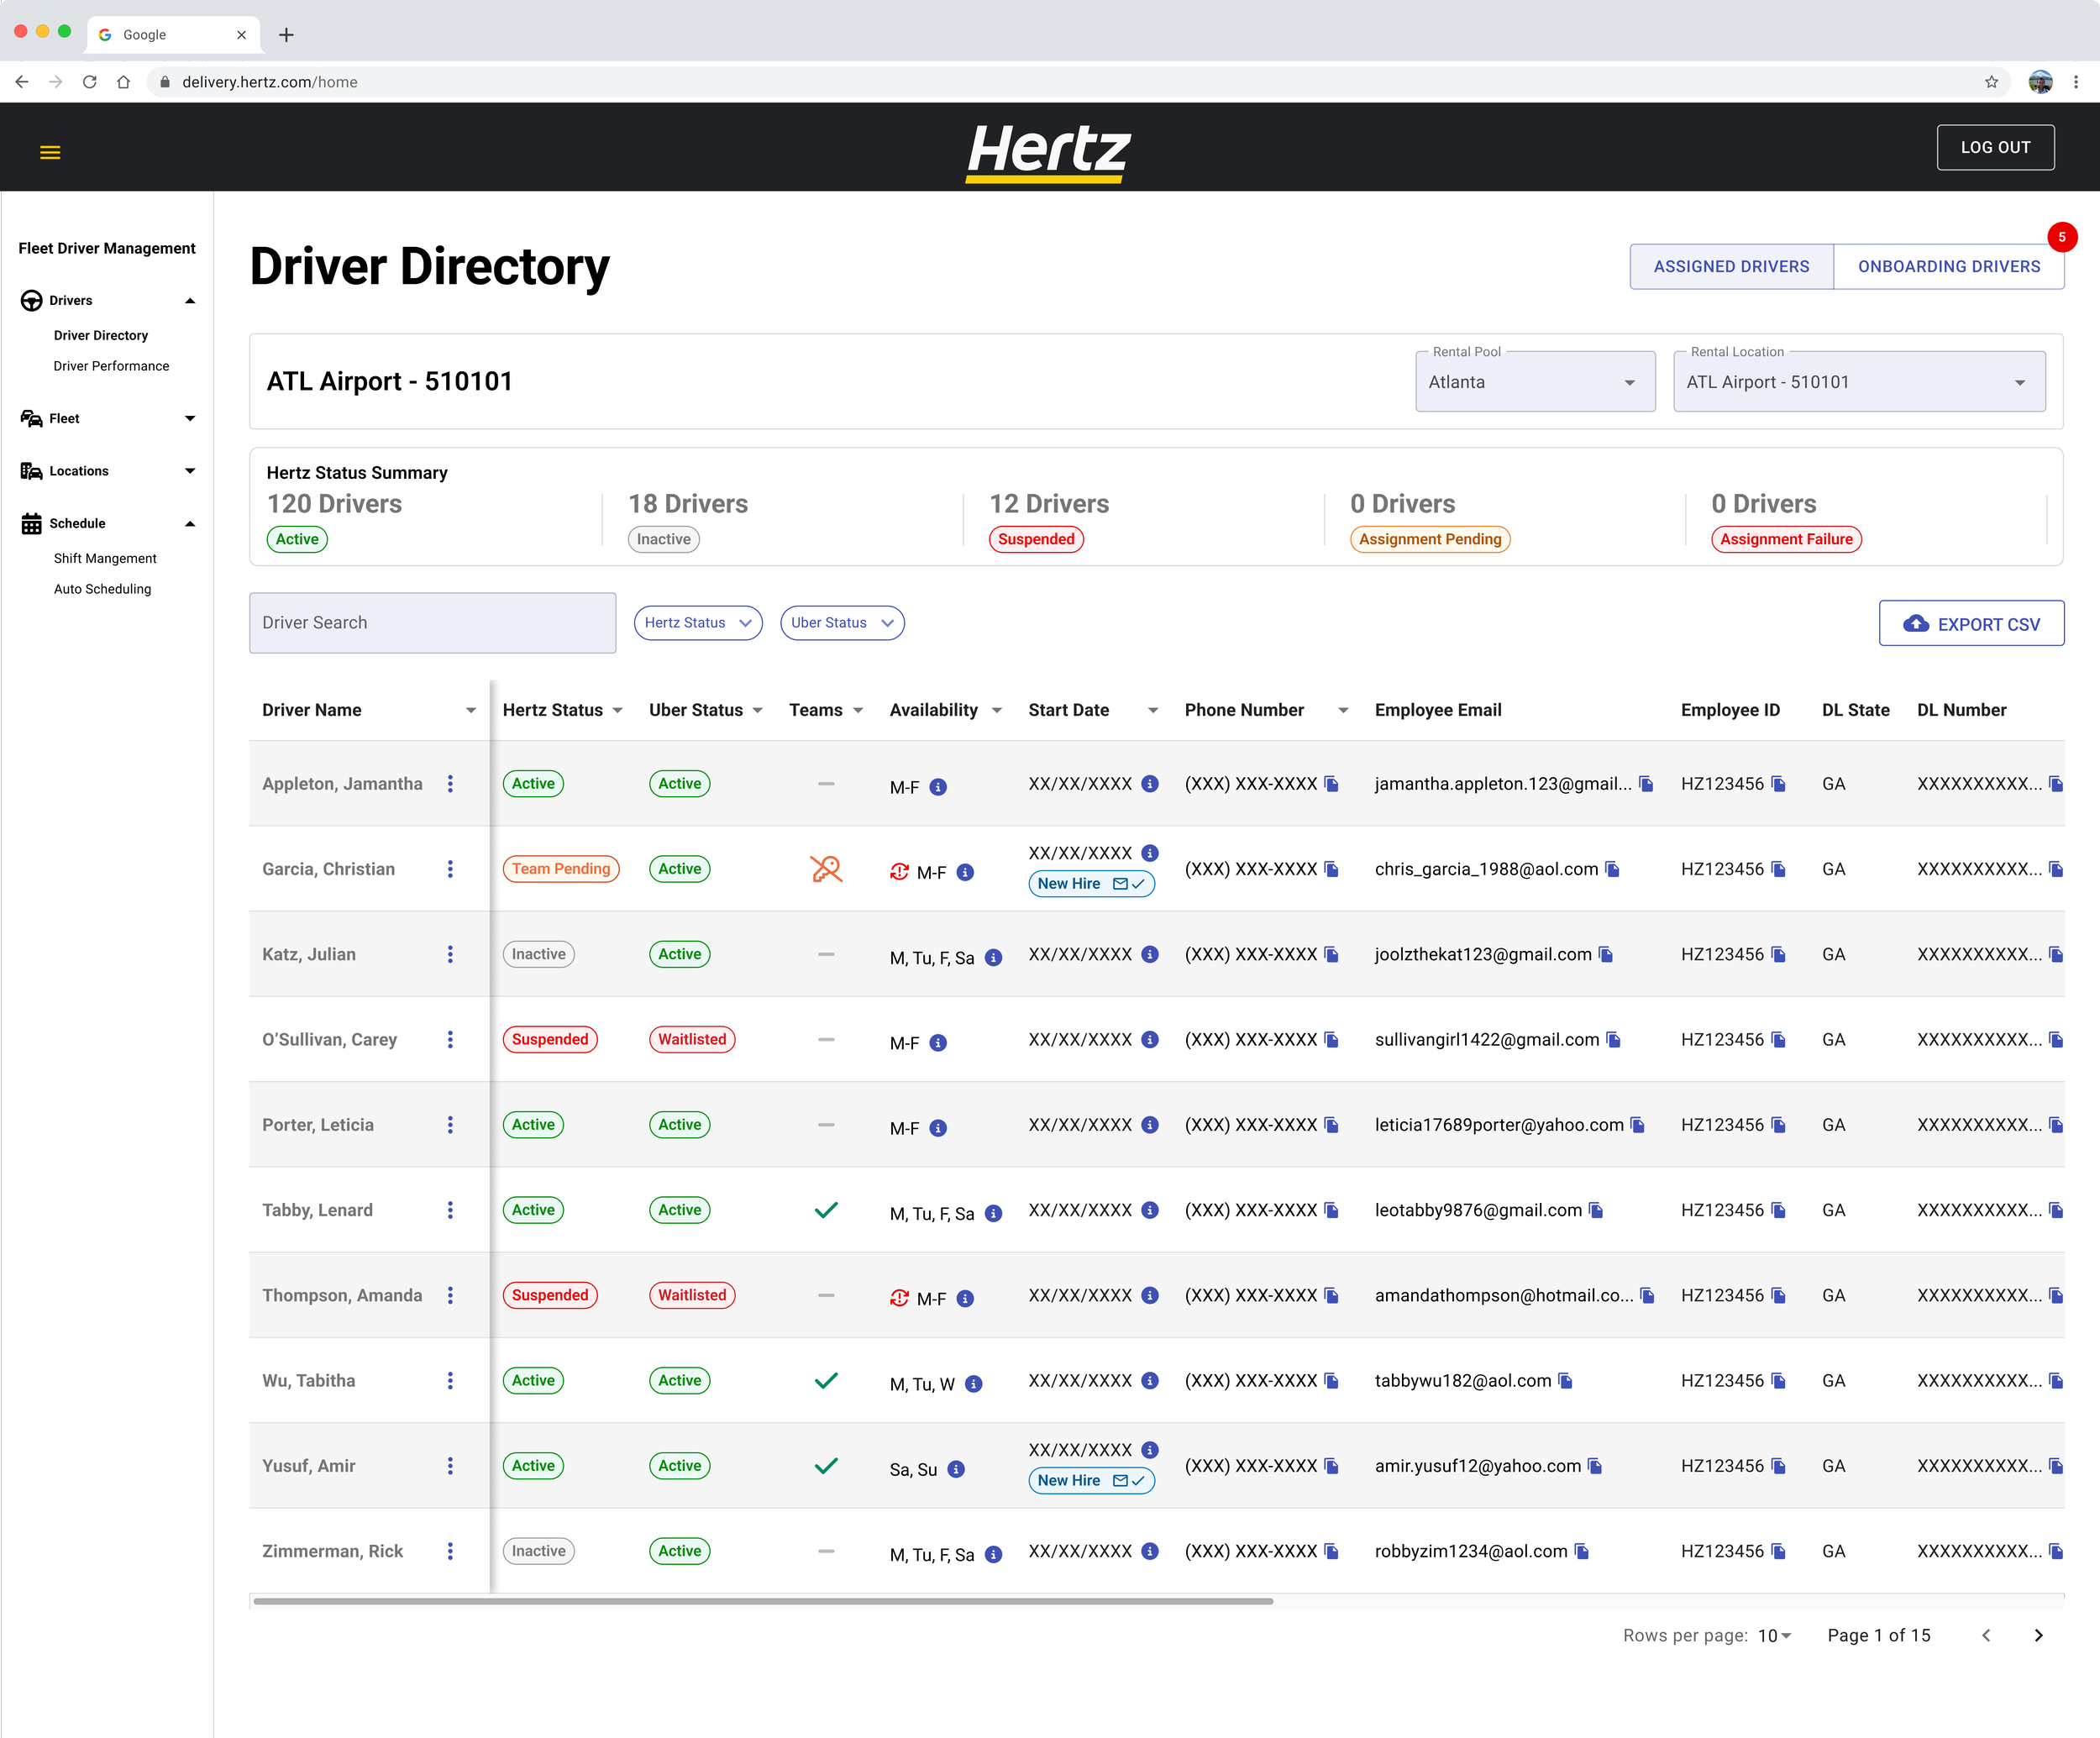
One of the primary goals of the directory was reducing the amount of time managers spent tracking information across disconnected systems.
To support the large amount of information required by managers, the interface emphasized scanability. Summary cards, status indicators, and repeated patterns surfaced important information at a glance, while more detailed information was available through hover states and secondary views.
By combining employee records, onboarding progress, operational standing, and communication history into a single workspace, managers could spend less time gathering information and more time acting on it.
Tracking Progress Through Onboarding
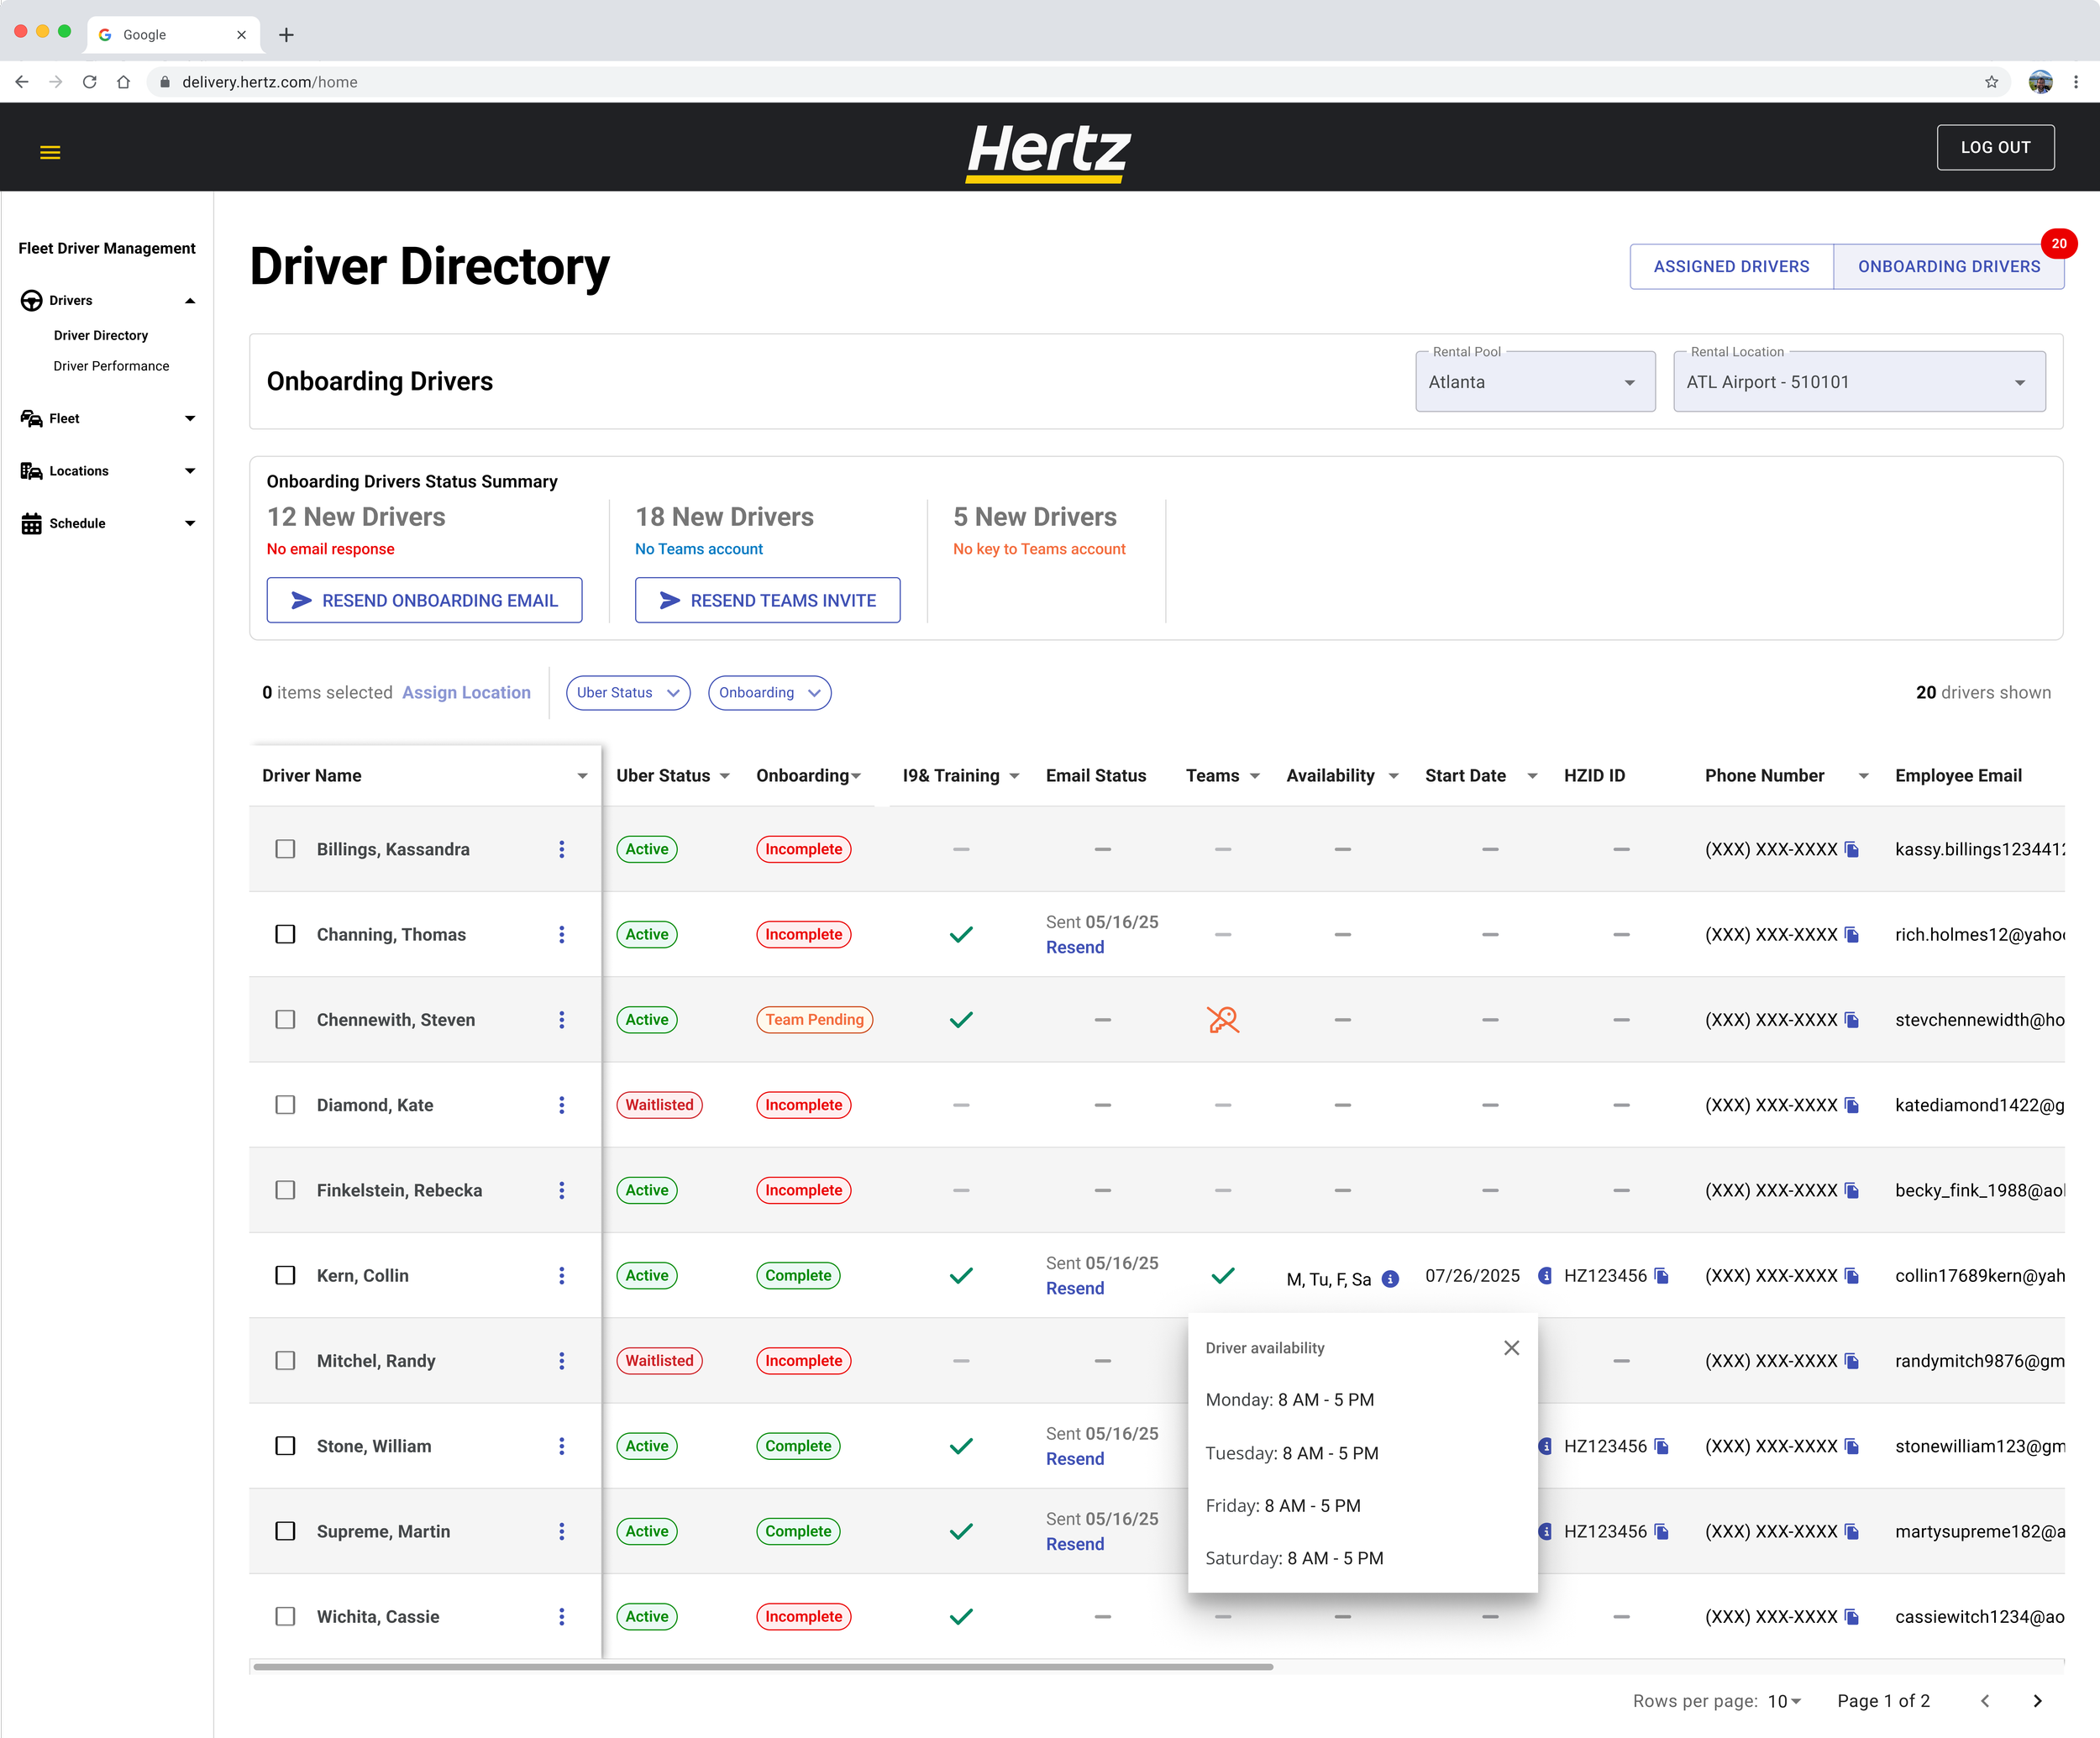
The onboarding view allowed managers to easily track prospective employees through their onboarding process all in one place.
As steps were completed by the driver, statuses updated automatically and downstream manager actions could be triggered, such as sending follow-up emails or creating employee accounts.
Once onboarding requirements and Uber background checks approval were complete, drivers became eligible for assignment to a location.
Auto Scheduling
Payments received the deepest design focus due to their frequency, emotional impact and being the largest pain point for drivers.
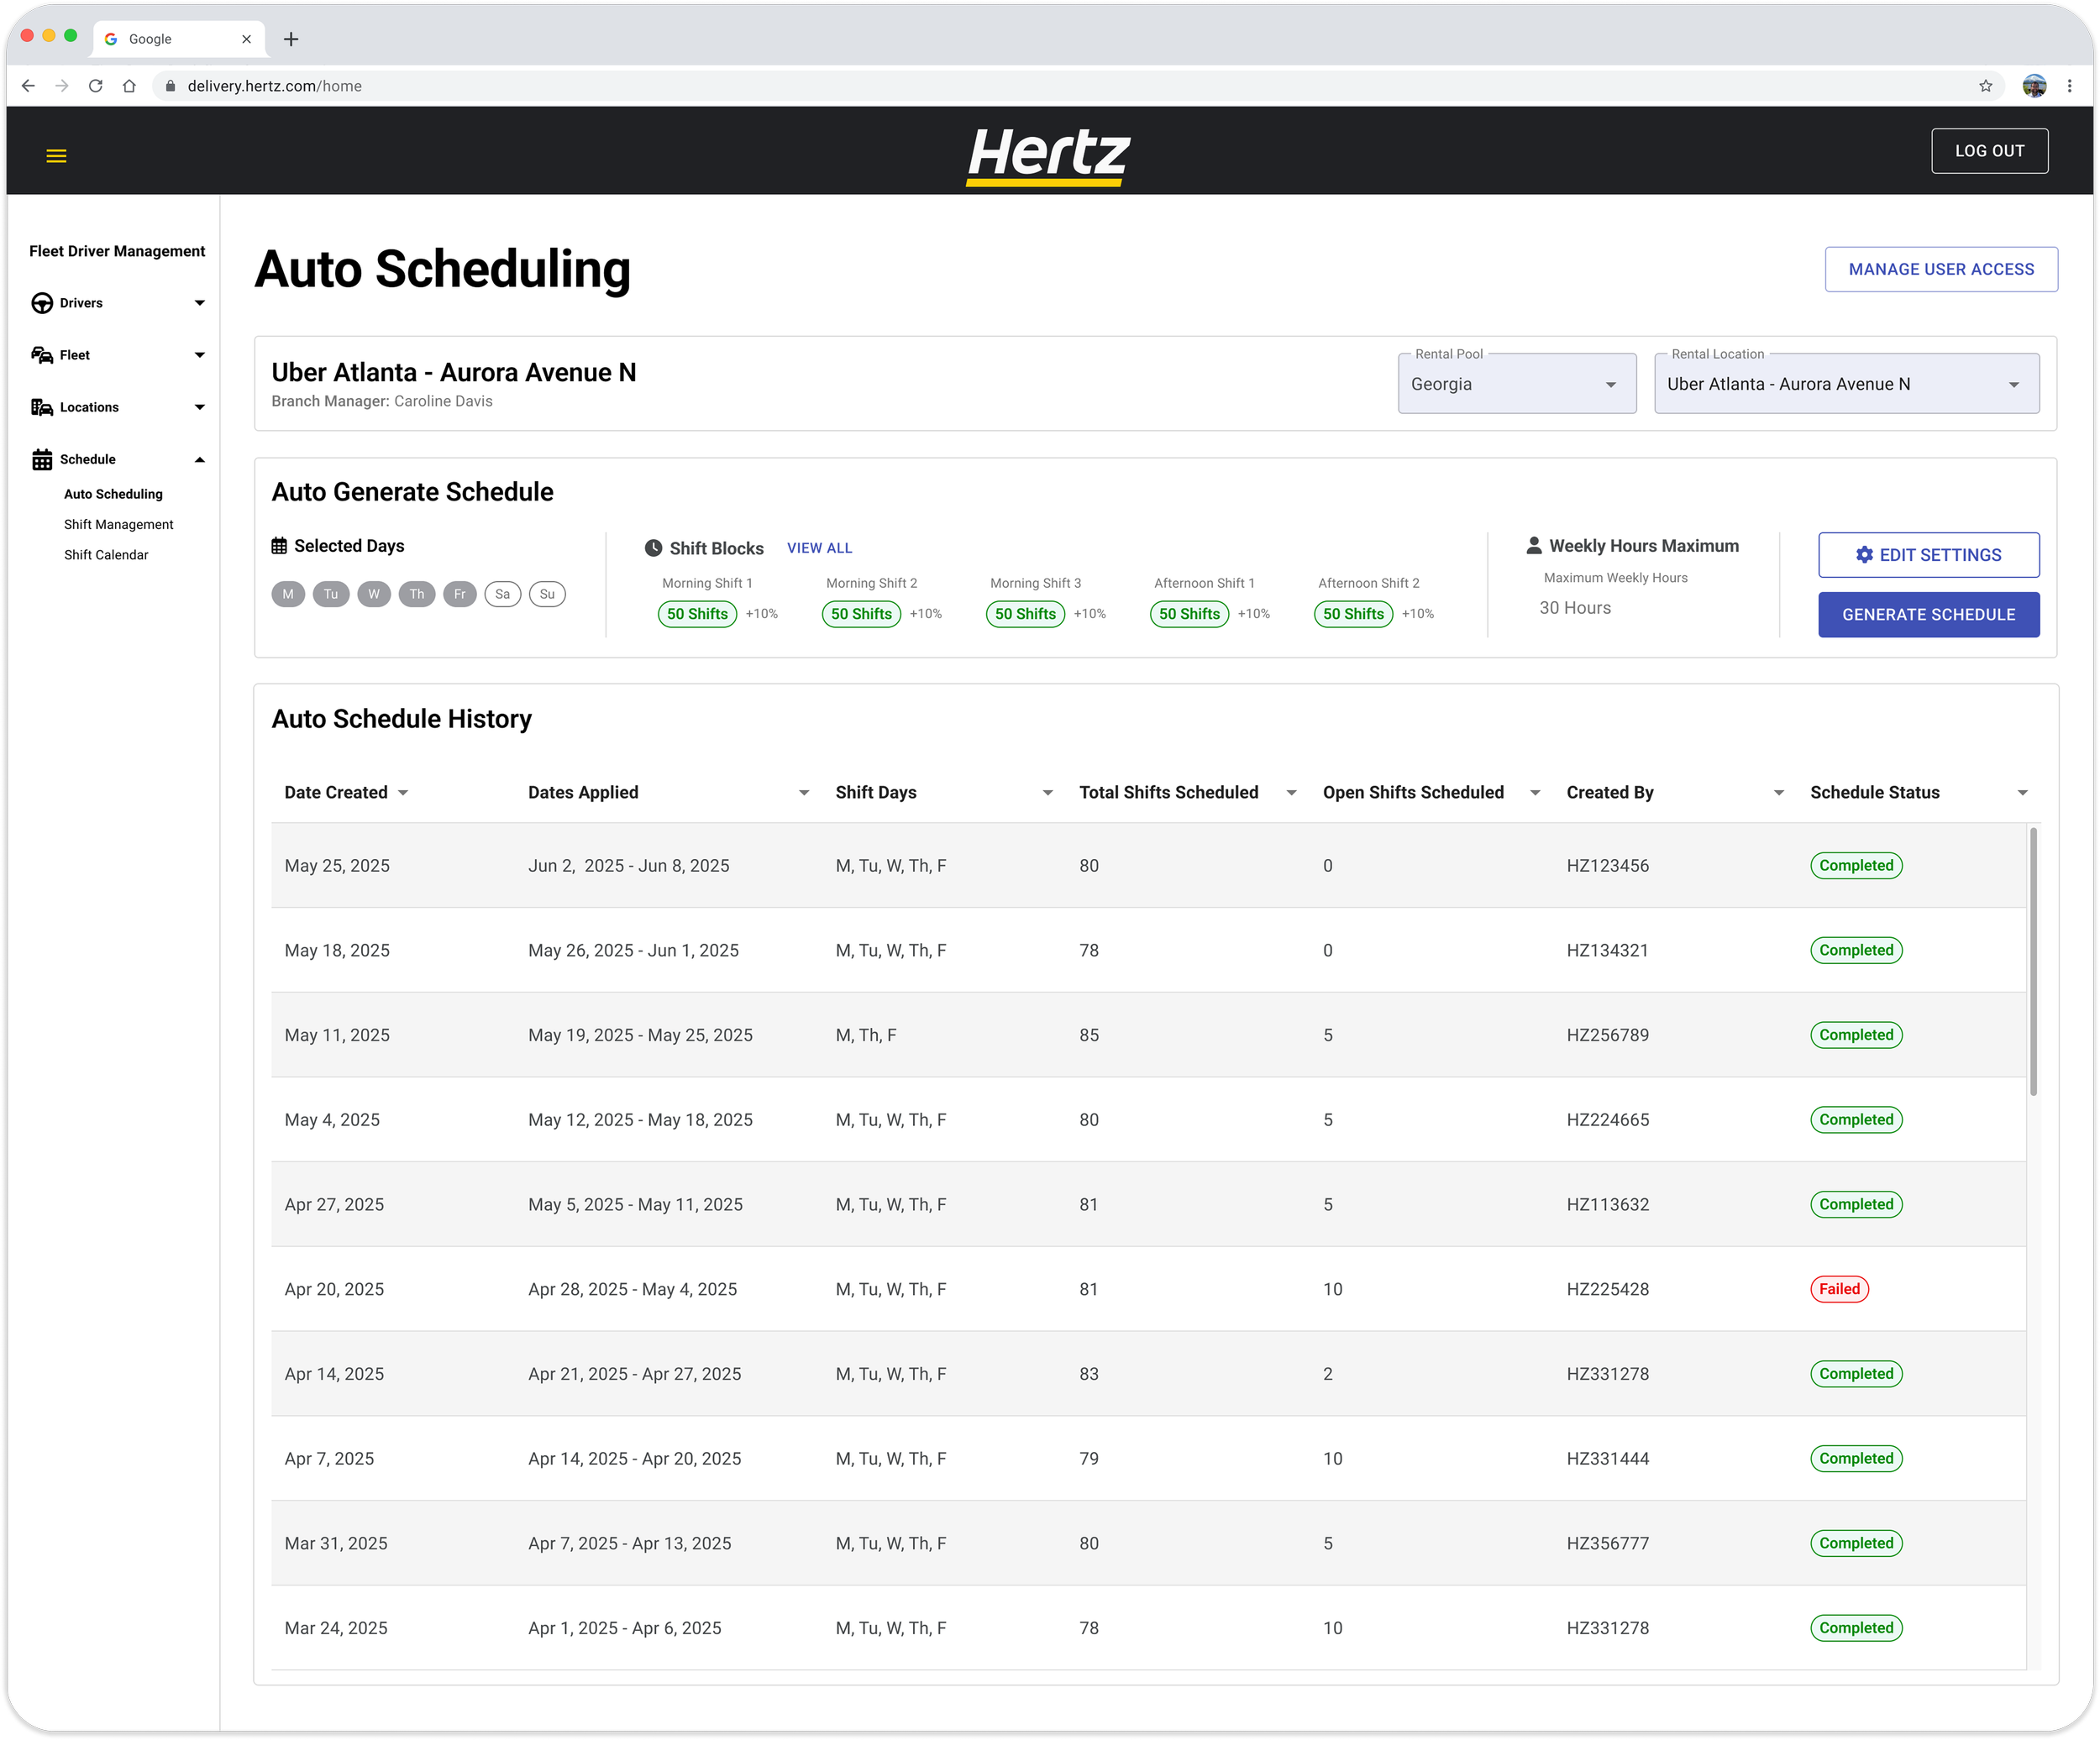
An automated scheduling system was introduced to reduce manual planning.
Managers could define scheduling needs and constraints
The system generated suggested schedules based on availability and requirements
Adjustments could be made manually when needed
This reduced the time required to build schedules and improved consistency across locations.
Auto Scheduling Configurator
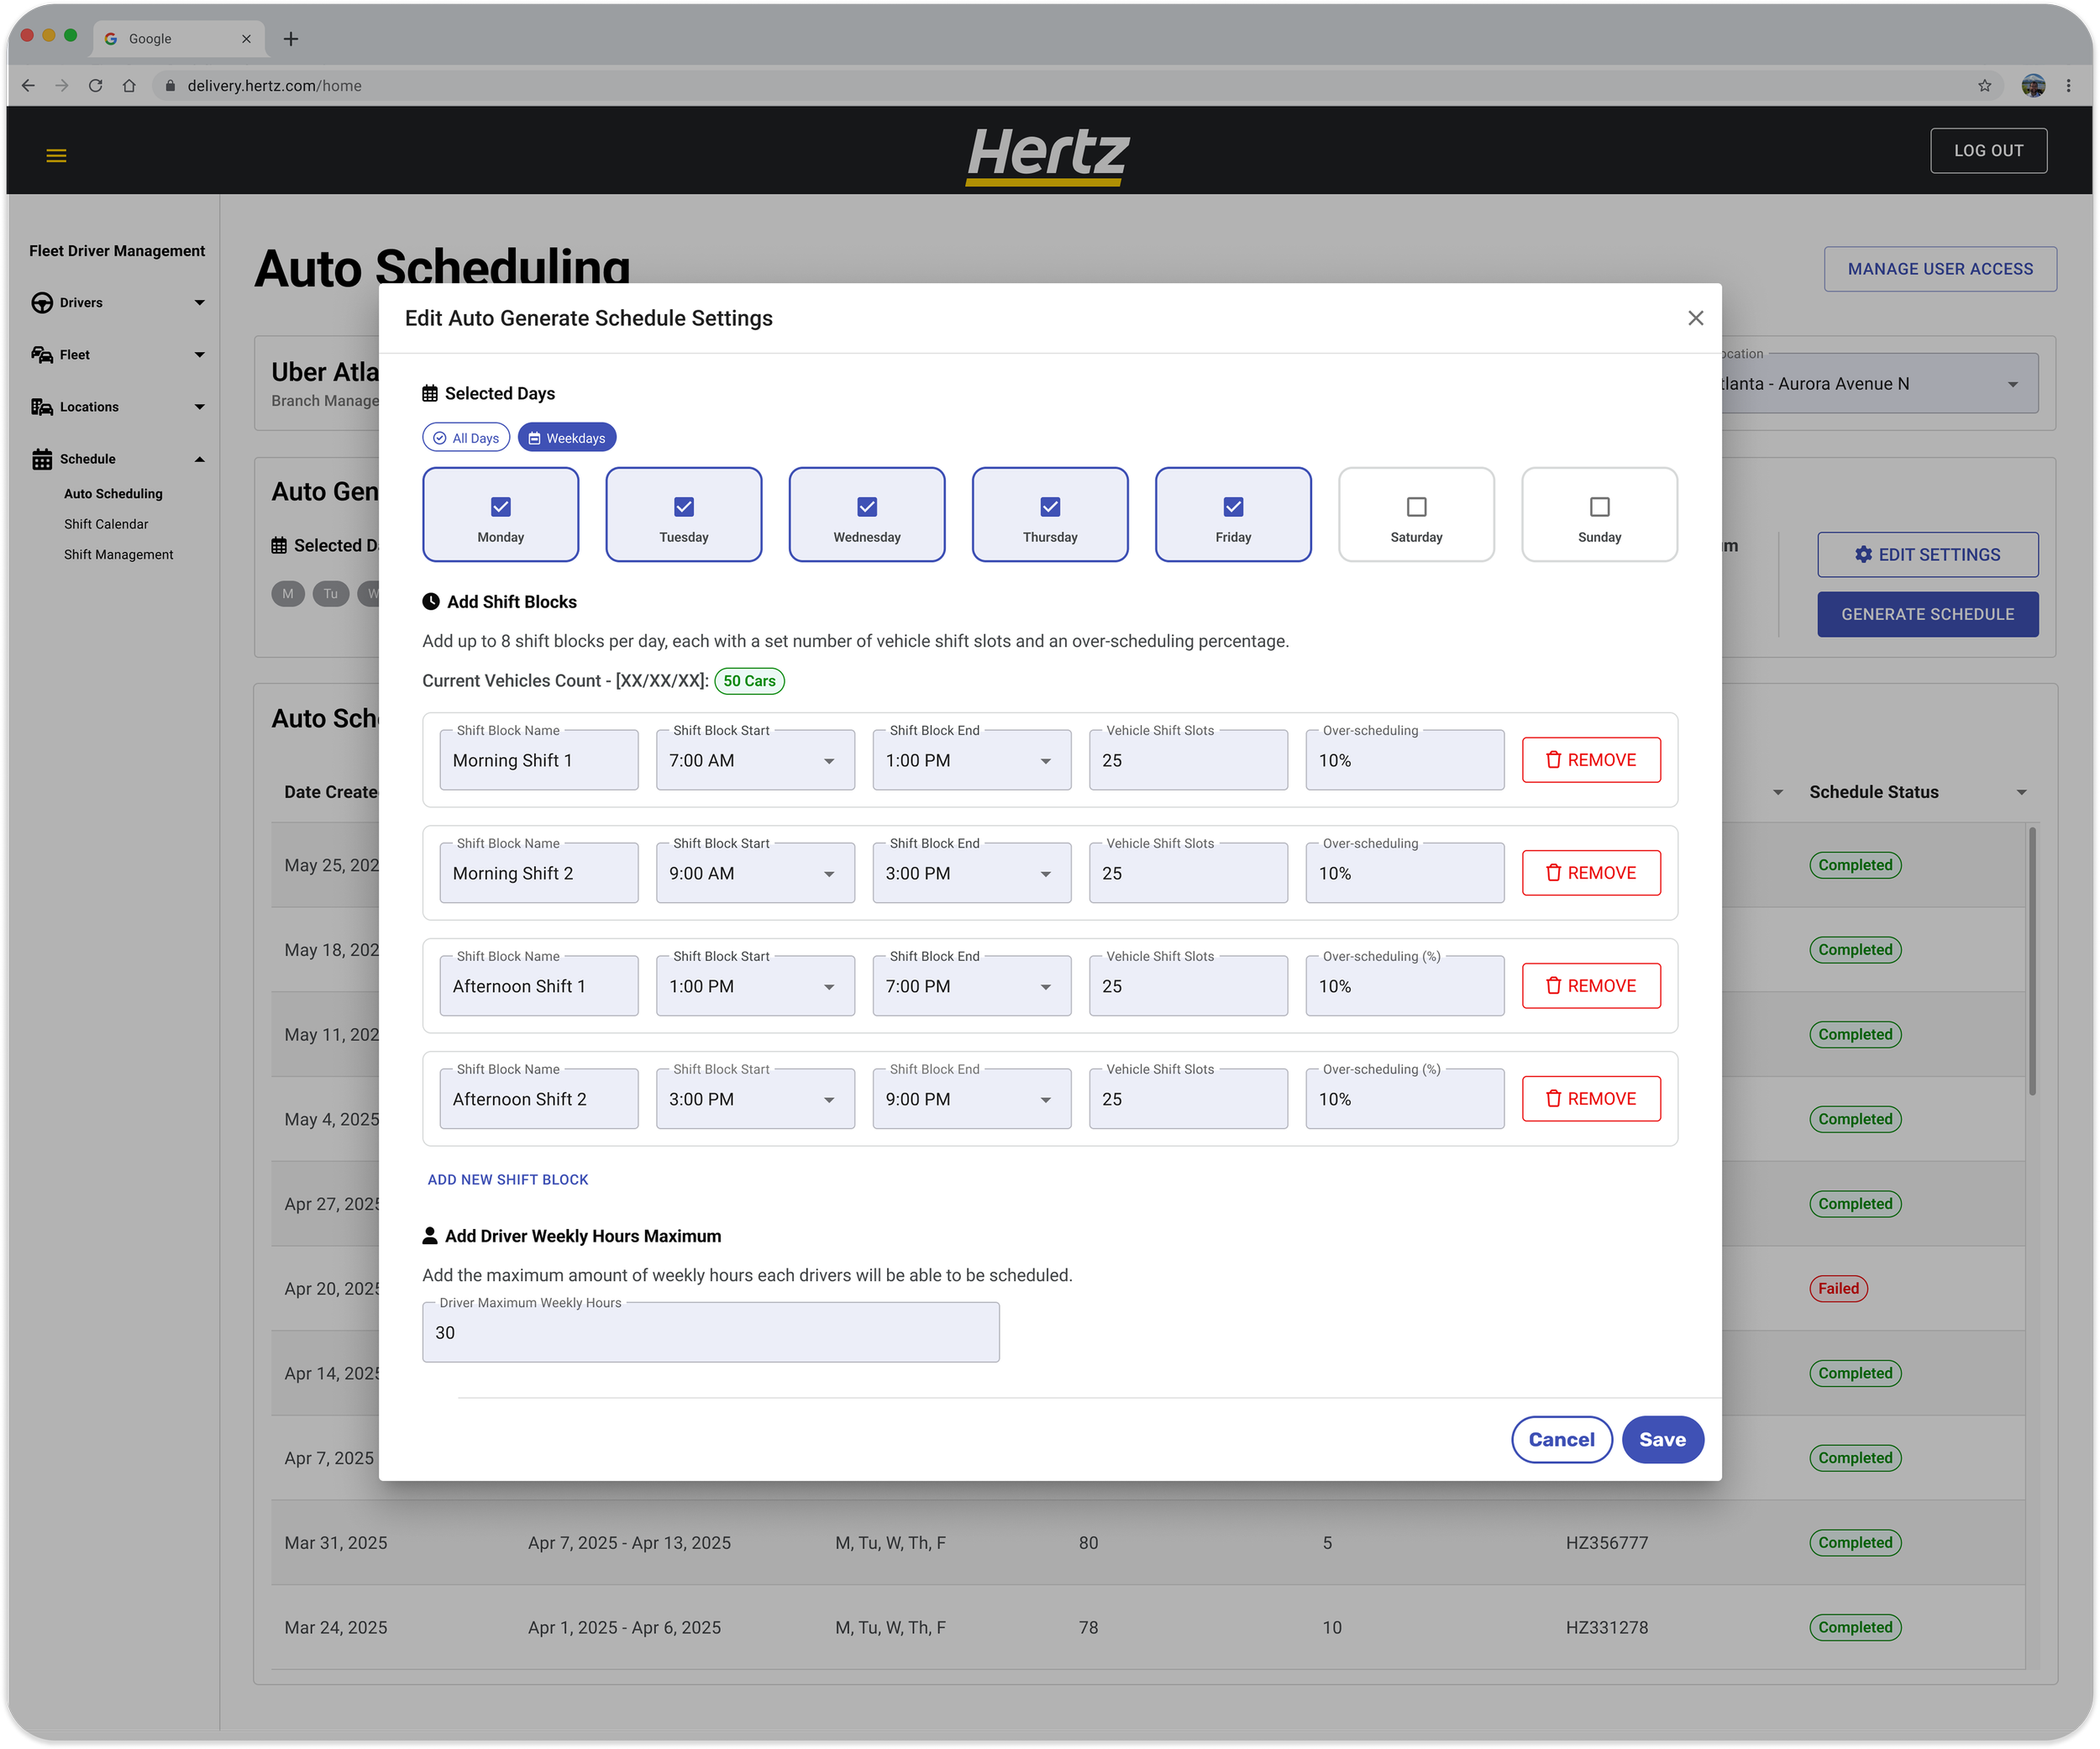
Managers could create reusable scheduling templates by defining:
Days of the week
Shifts per day
Driver count per shift
Over-scheduling percentages for no-shows
Maximum weekly driver hours
Schedules could then be generated automatically from these configurations, reducing manual coordination and improving consistency, while still allowing managers to make manual adjustments when needed.
Schedule Generation
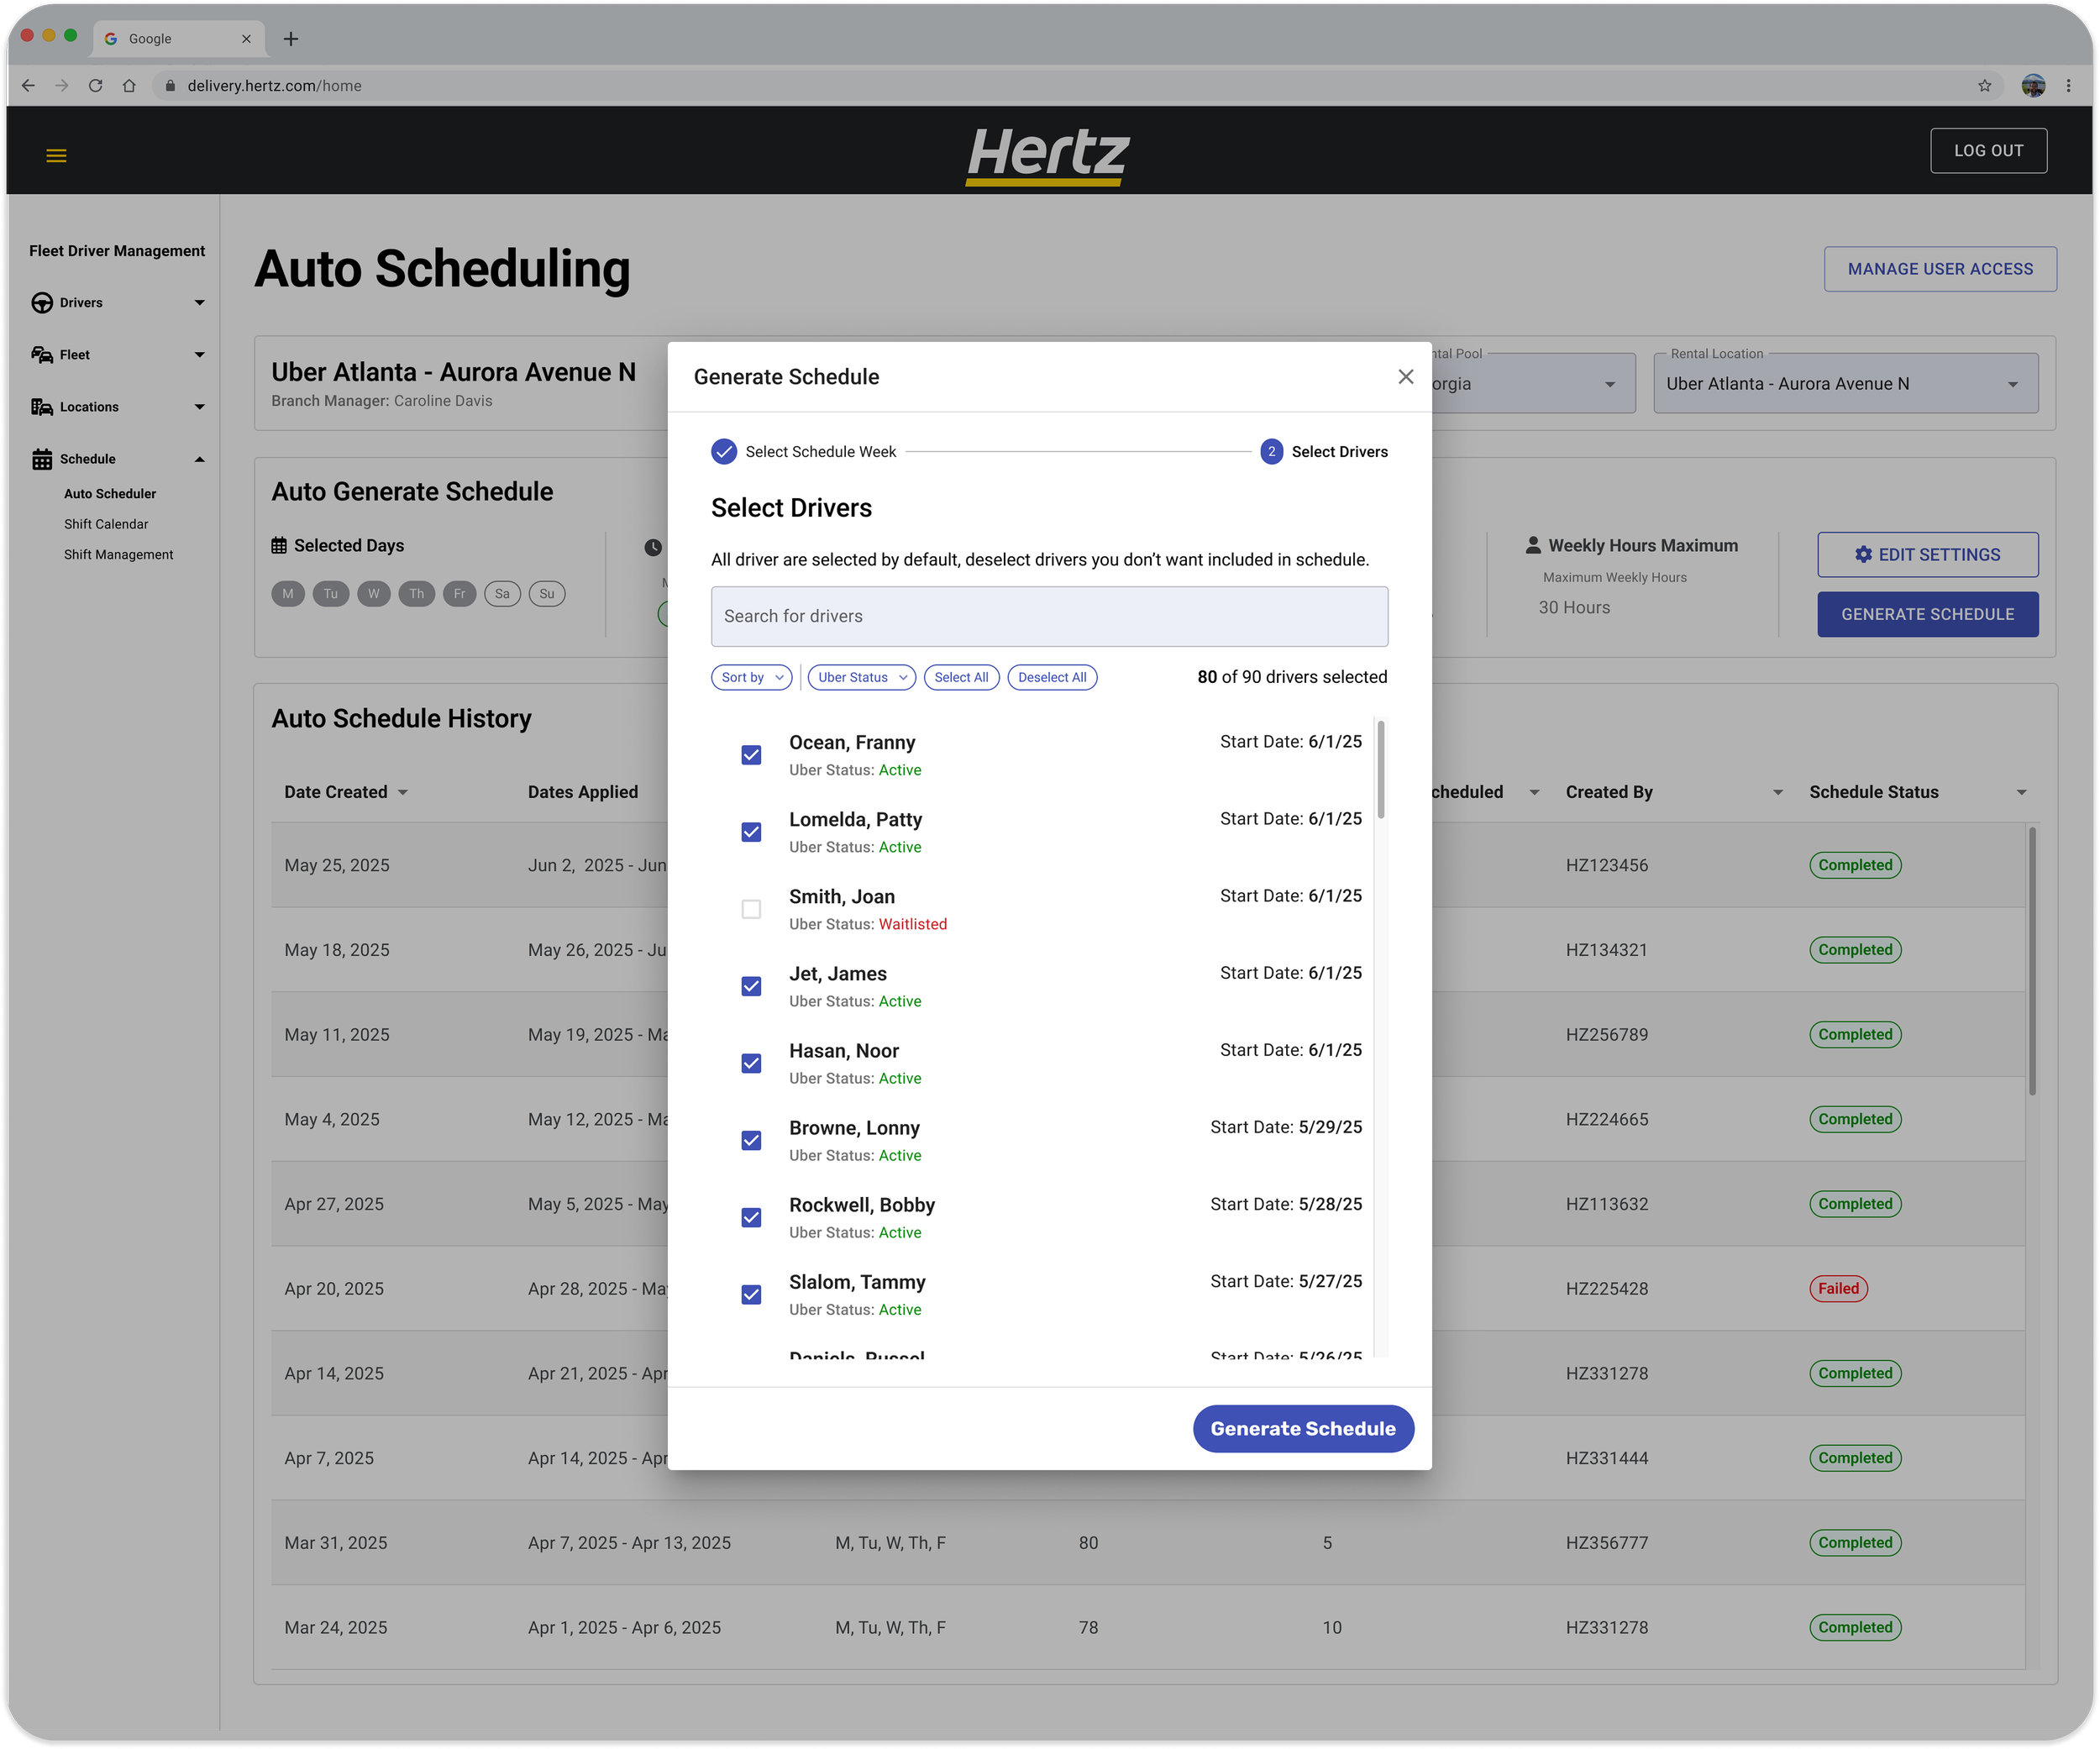
Once a schedule configuration was created, managers could generate a weekly schedule by selecting the week the template should apply to.
Before finalizing the schedule, managers could:
Include or exclude specific drivers
View driver status indicators, such as probation status
Sort and filter drivers based on operational needs
This allowed schedules to be generated quickly while still giving managers flexibility and oversight.
Shift Management
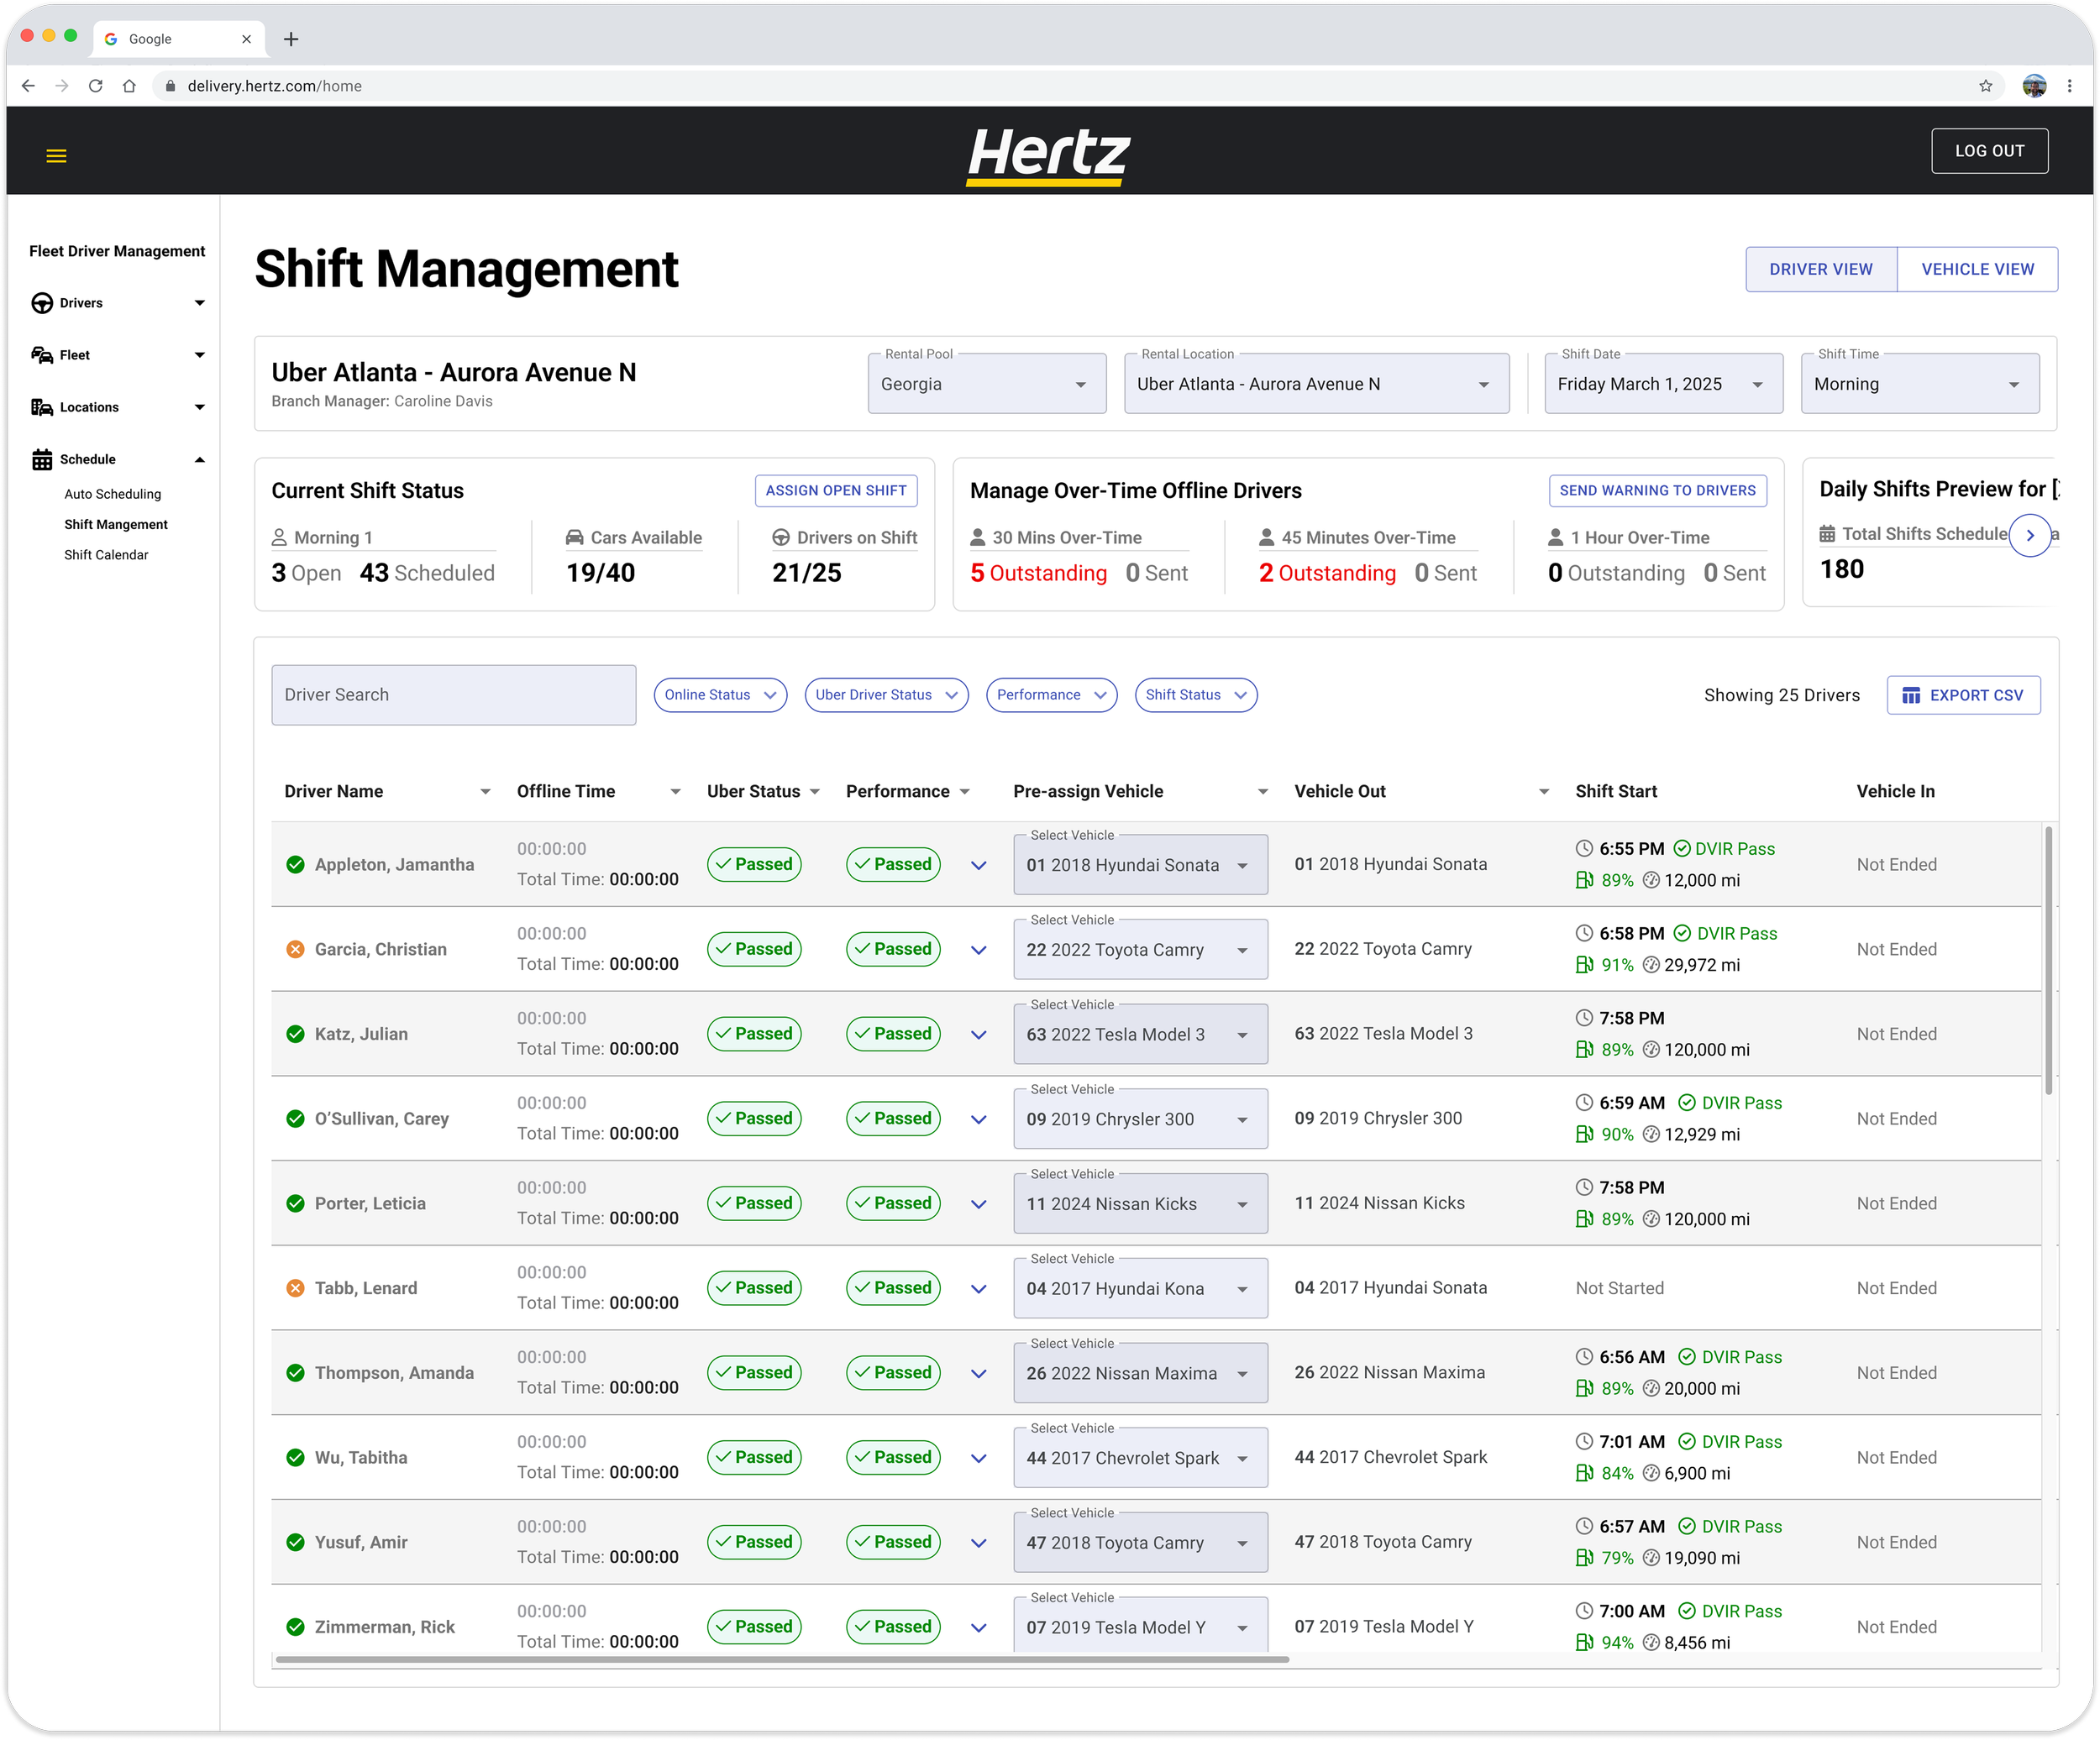
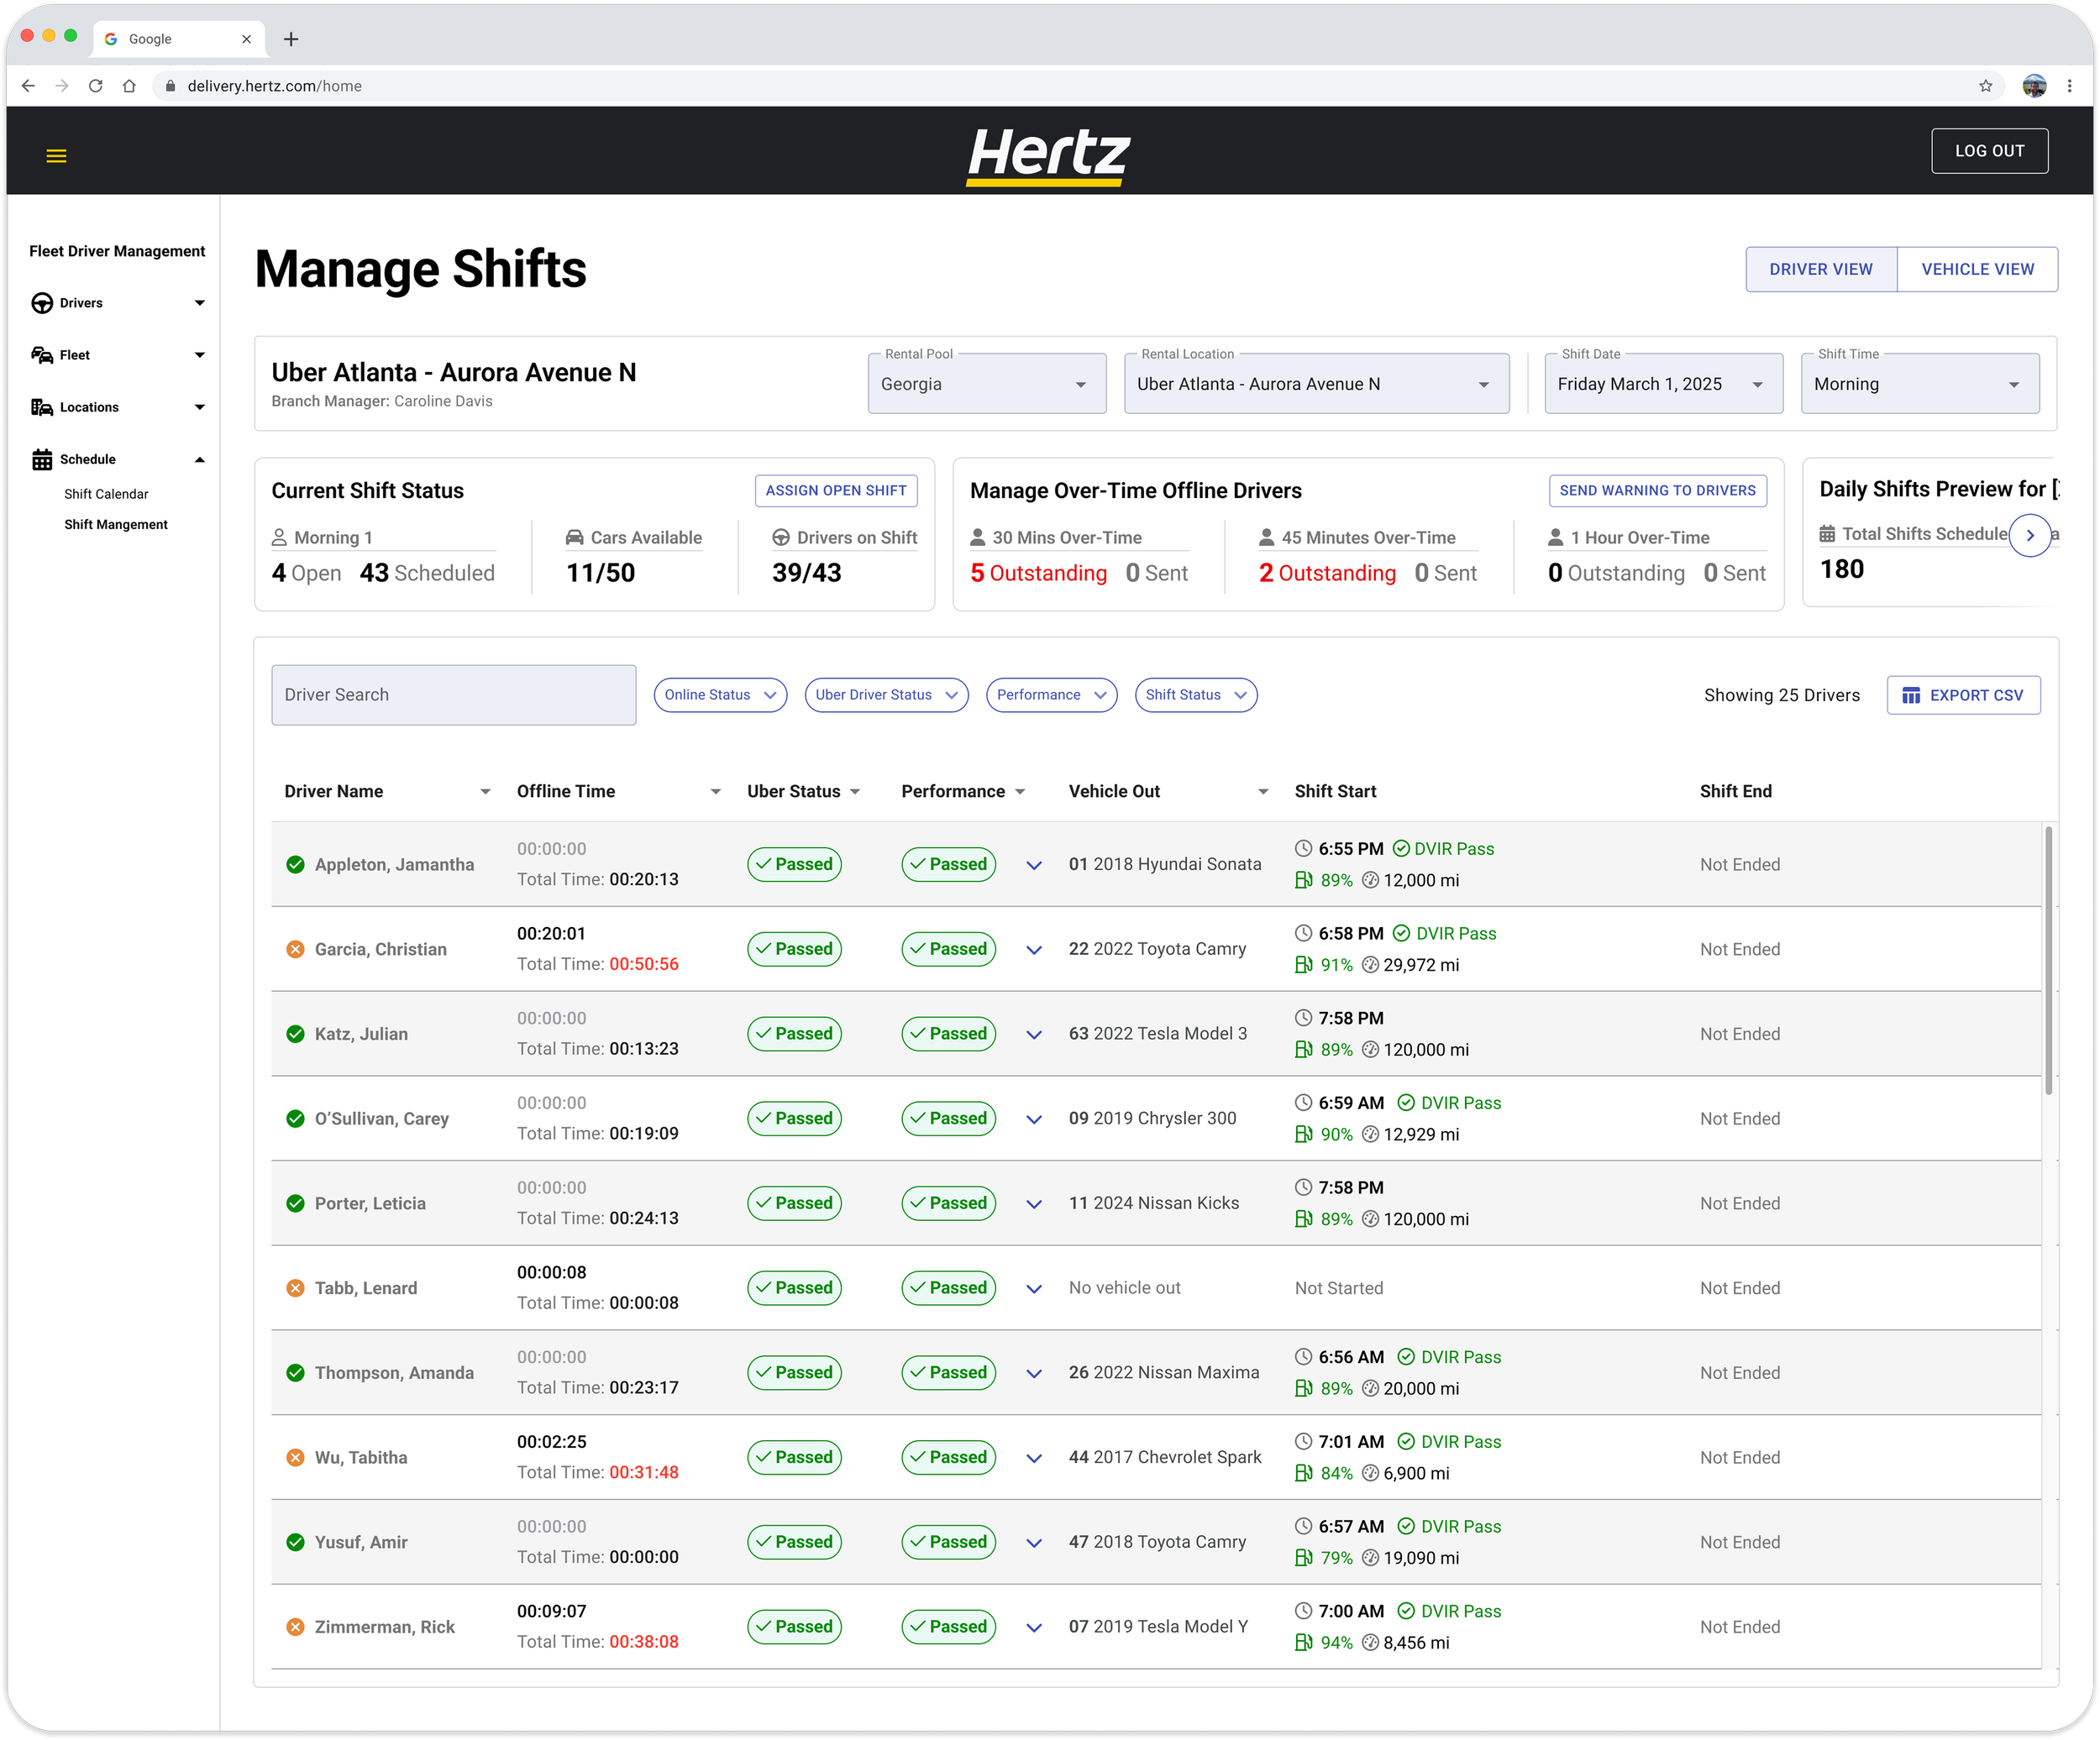
The Shift Management view was designed to give managers a real-time overview of active shifts across drivers, vehicles, and performance metrics.
Real-Time Shift Visibility
Managers could:
Search for individual drivers
Filter by operational and performance statuses
Monitor active and cumulative offline time
View attendance and shift progress in real time
Managing Over-Time Offline Drivers
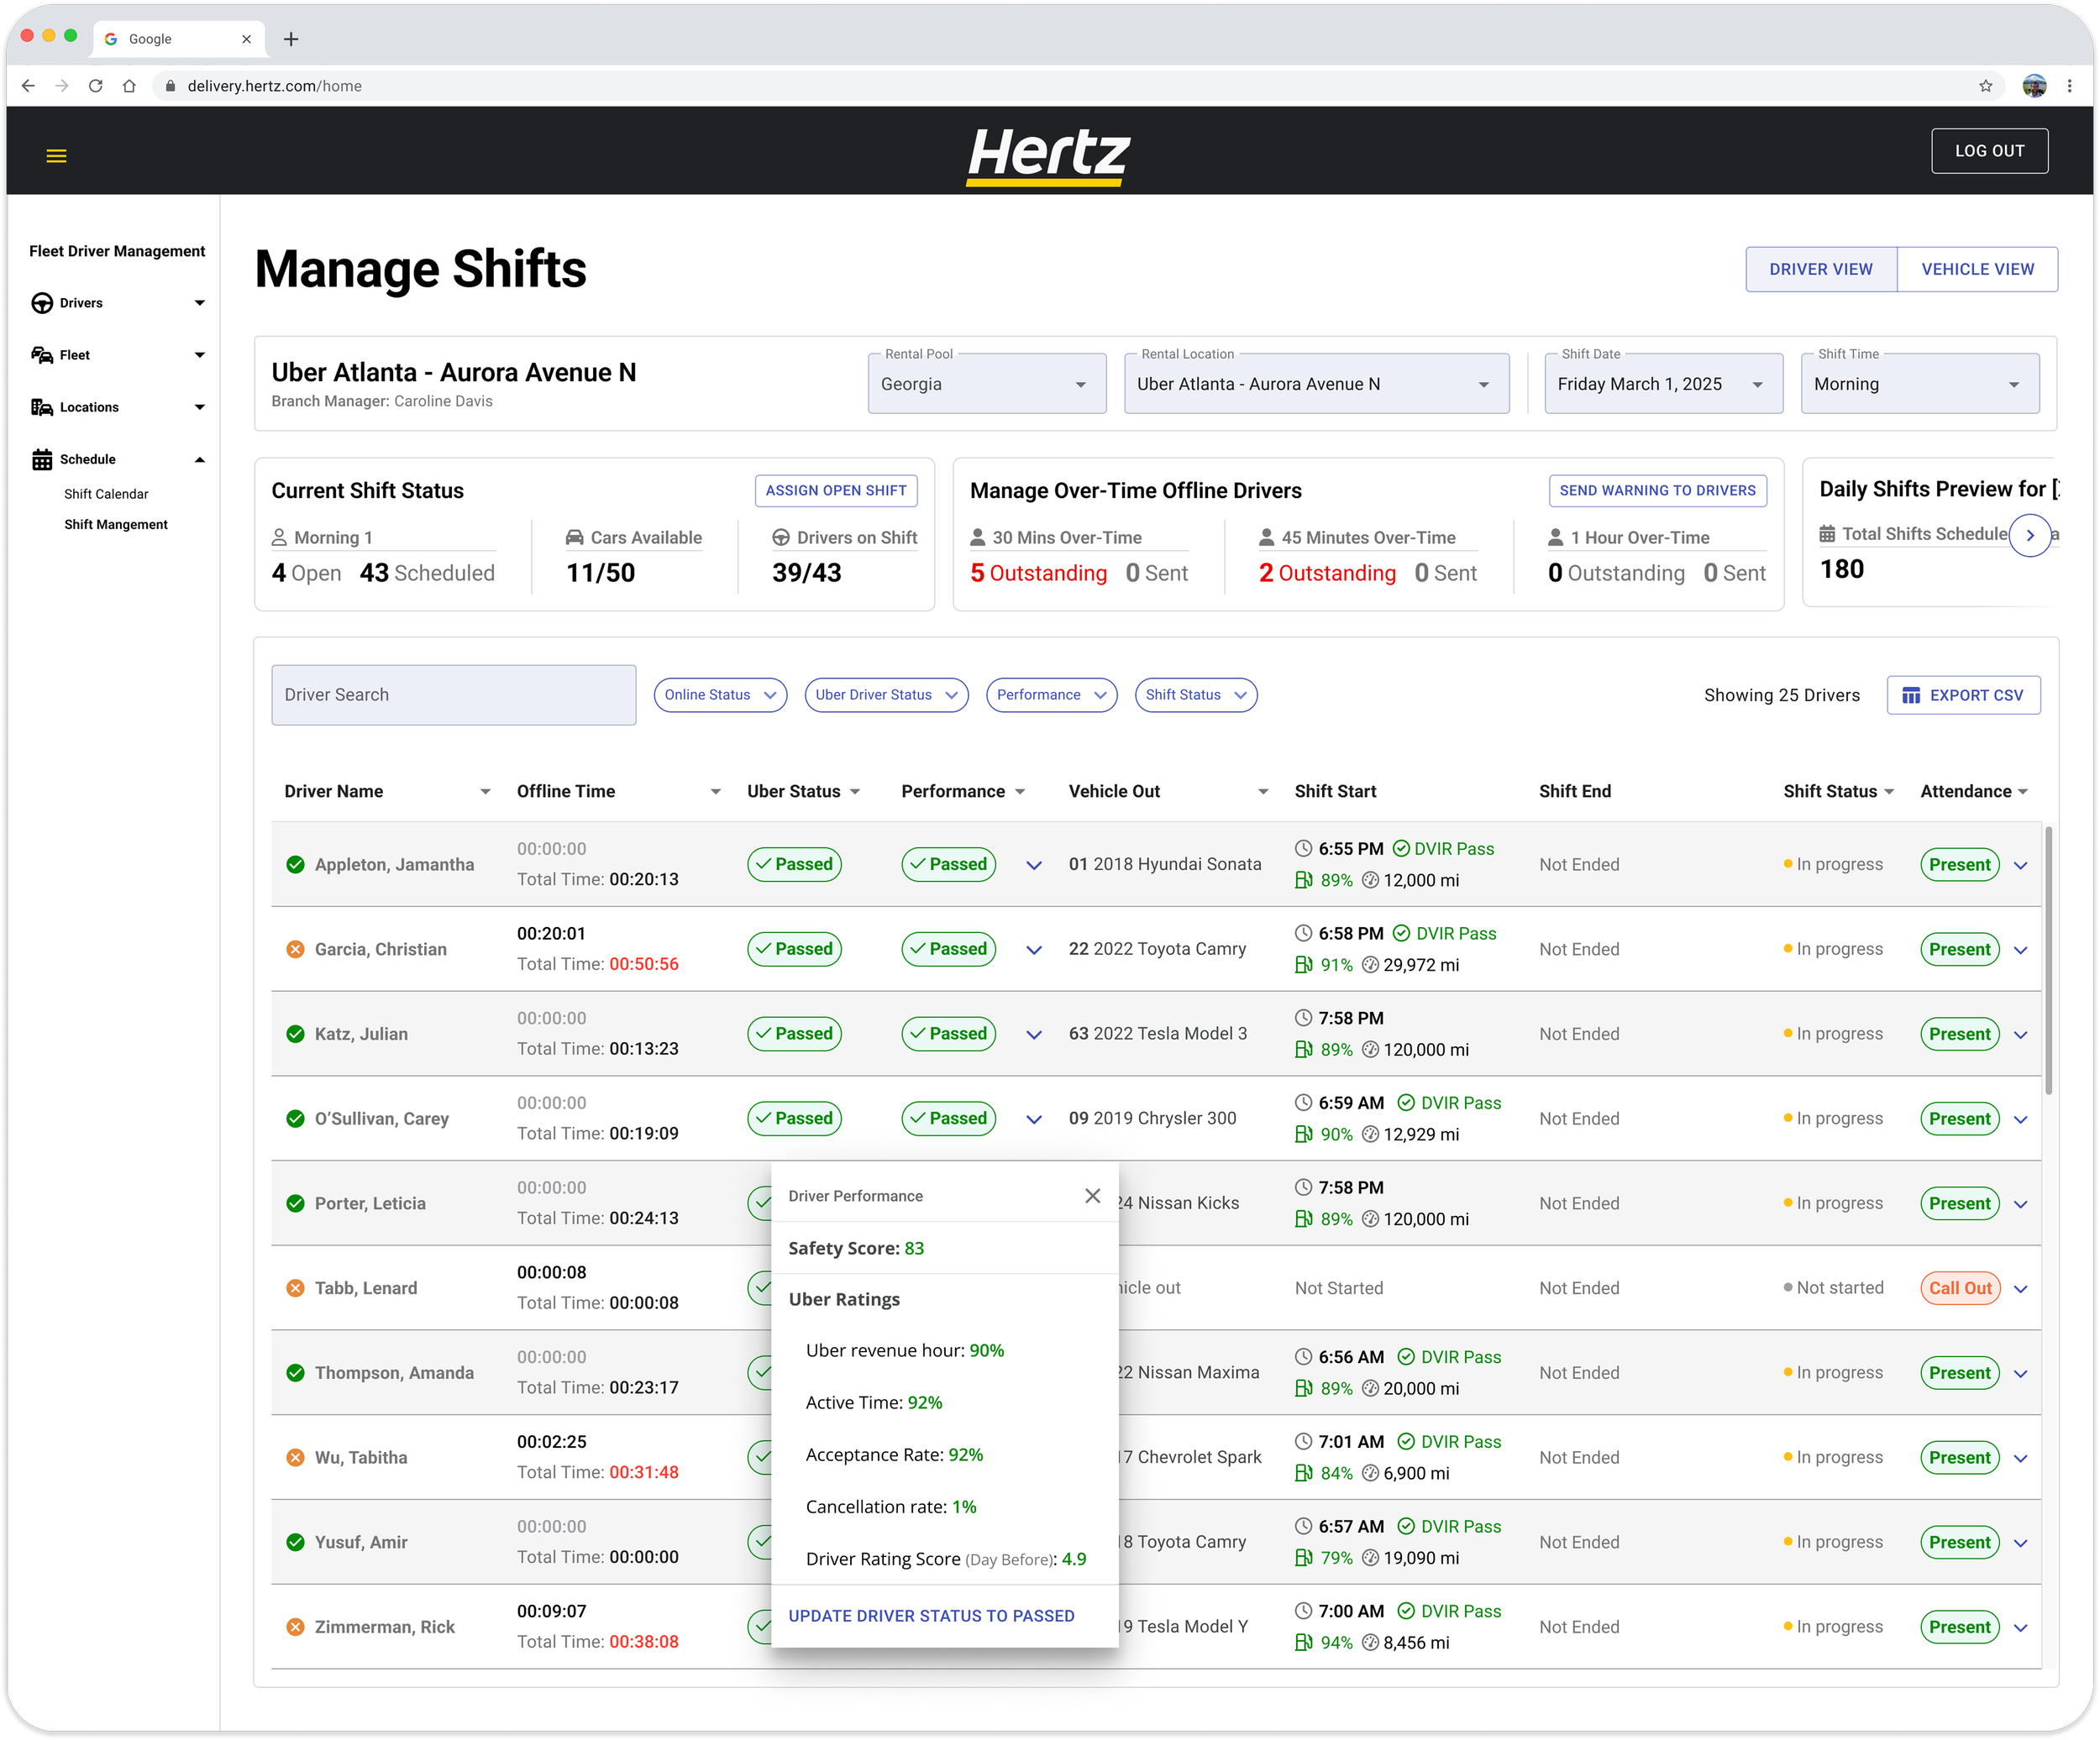
Additional visibility was provided into drivers exceeding allotted offline time during their shift. Thresholds for extended offline activity were surfaced directly in the dashboard, alongside controls to send warning messages to affected drivers without leaving the page.
The goal was to reduce the amount of manual monitoring required while helping managers identify issues before they impacted operations.
Driver Performance and Shift Monitoring
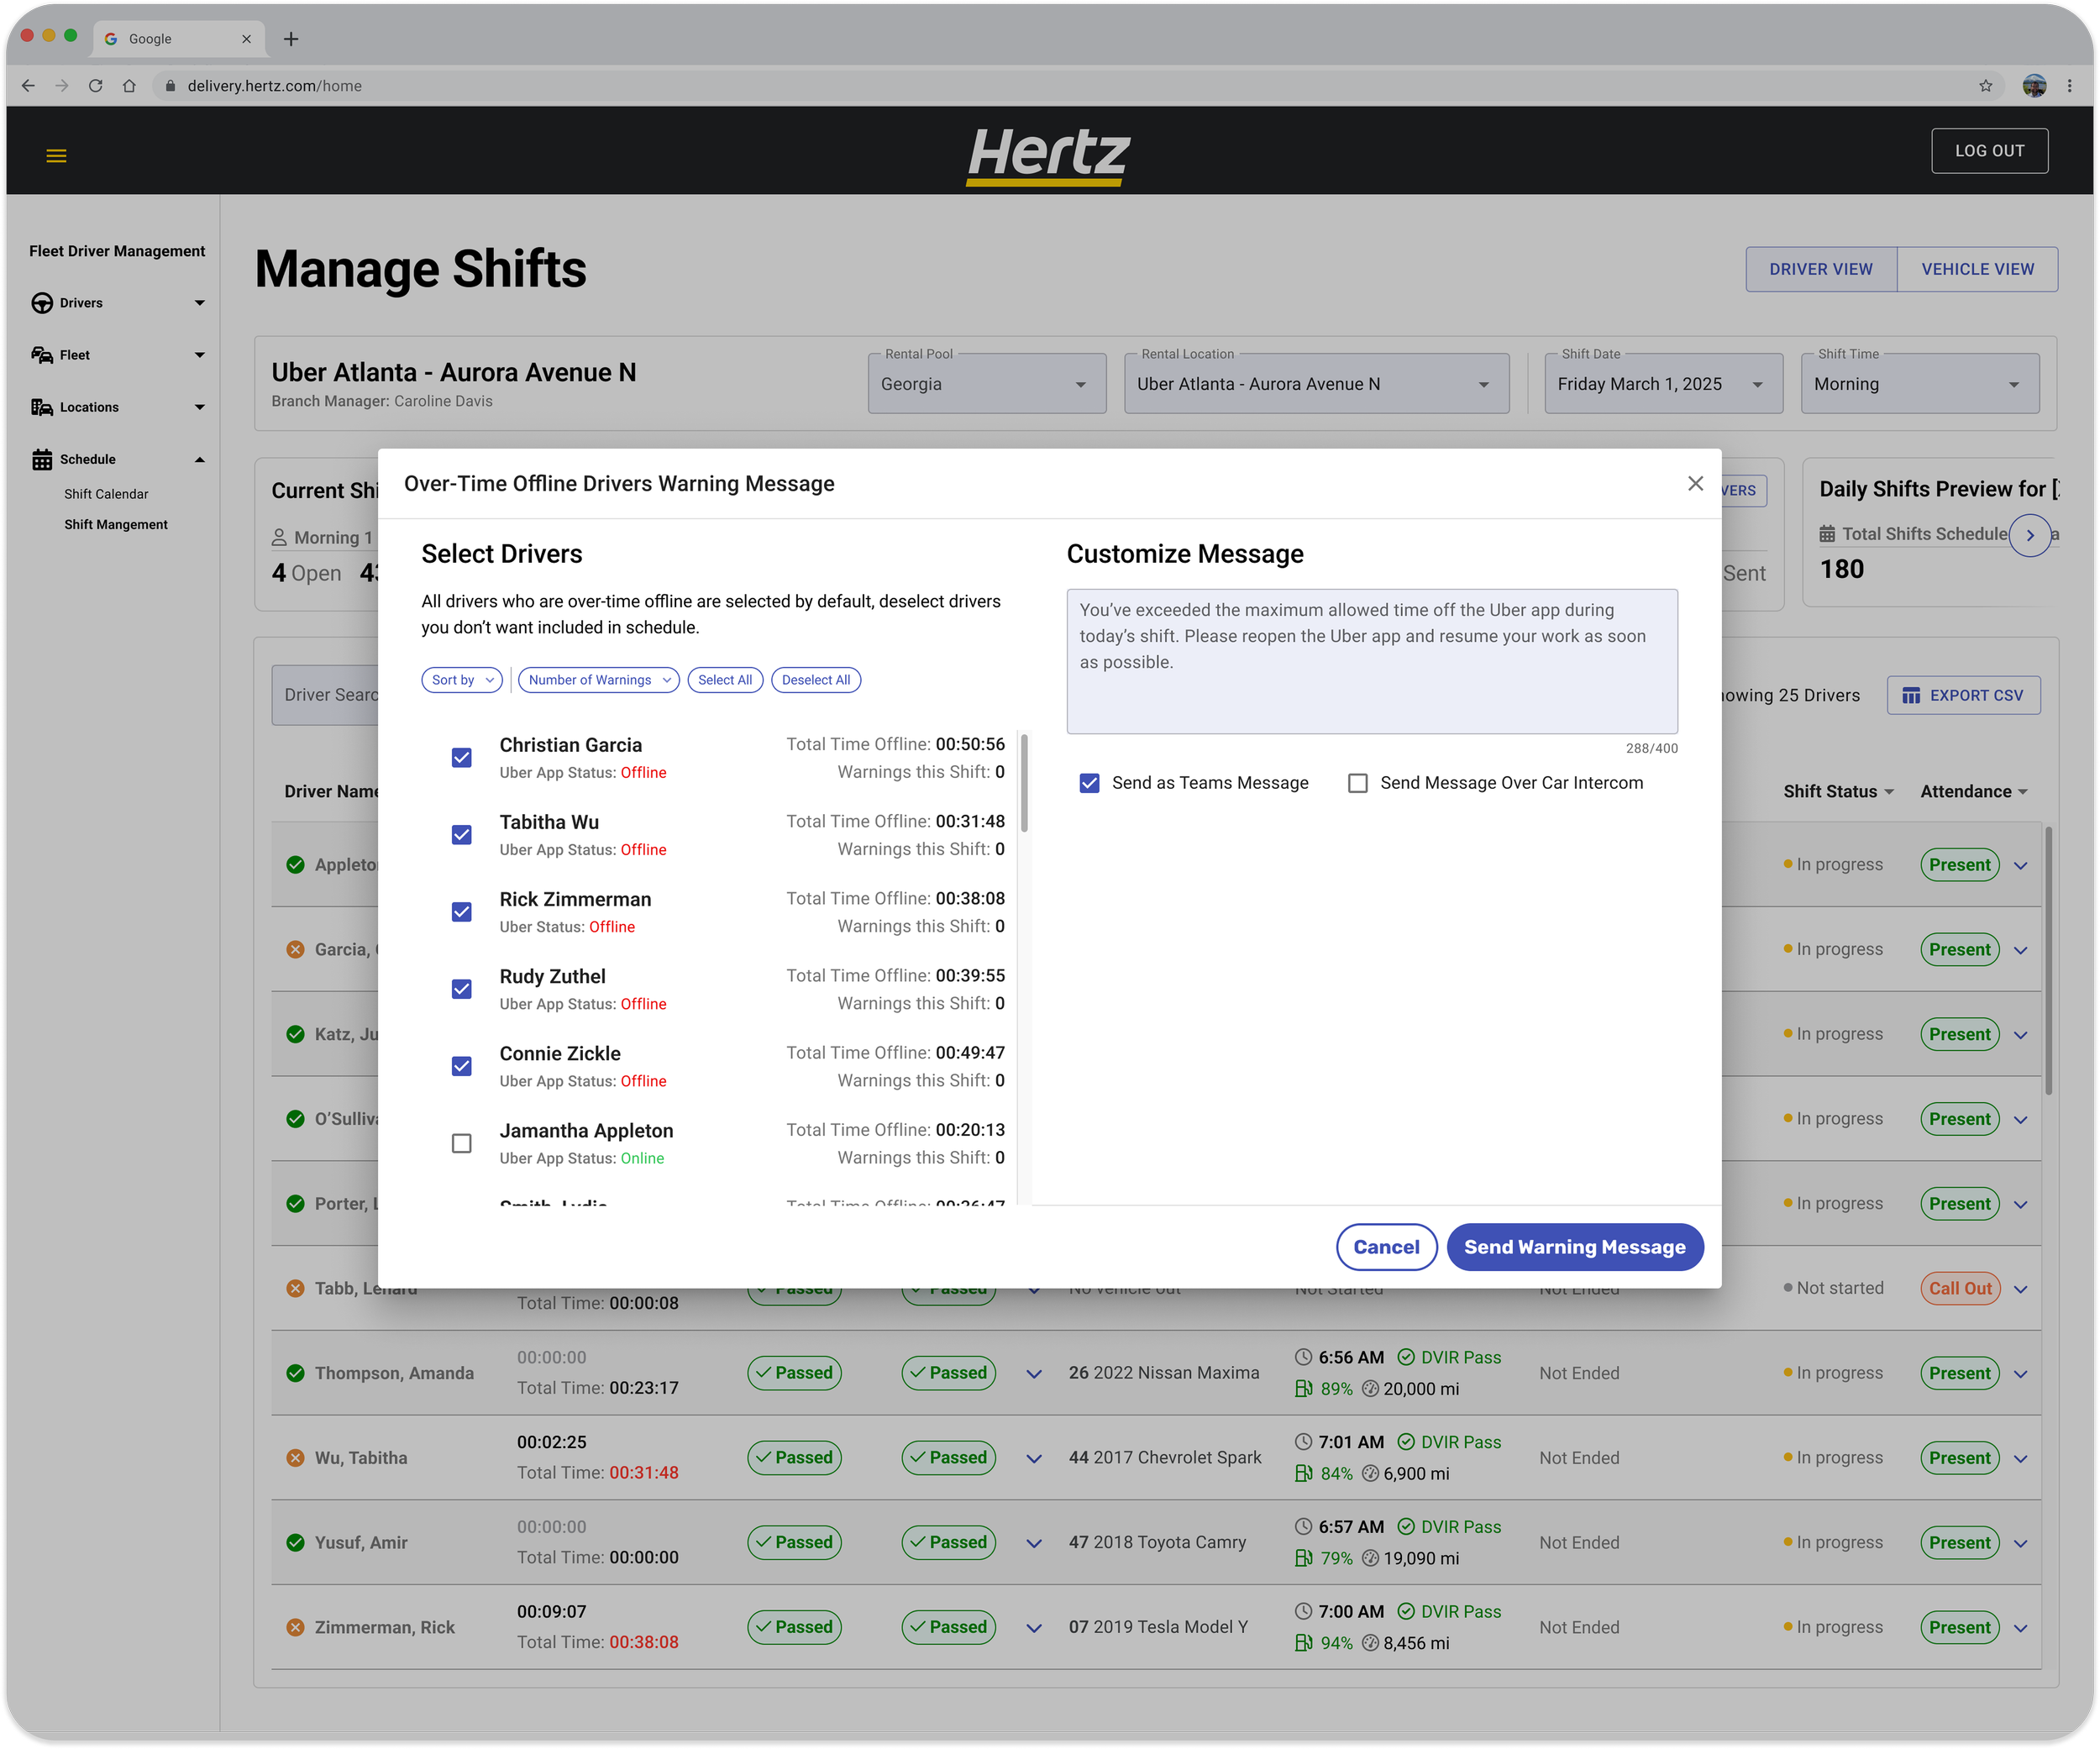
Performance visibility was intentionally simplified at the surface level but could be expanded for more detail.
Instead of exposing large amounts of raw data directly in the table, core statuses were represented through clear pass/fail indicators that could be expanded for deeper inspection when needed.
This allowed managers to quickly scan for issues while still supporting more detailed investigation when necessary.
Outcomes
Due to the previous process relying on managers to manually manage spreadsheets, email, and disconnected workflows, there was no centralized reporting or historical data available to directly measure improvements after the portal was introduced.
Consolidated onboarding, scheduling, performance tracking, and employee records into a single system.
Improved manager visibility into employee attendance, onboarding progress, scheduling, and performance, allowing issues to be identified and addressed earlier.
Created a scalable operational foundation that supported the rollout of five additional branches using standardized workflows and role-based access.
The portal also provided a scalable foundation for the business, supporting the rollout of five additional branches through standardized workflows, reusable scheduling tools, and role-based access.
Continuous feedback from managers throughout the design process helped shape the product and validated that it addressed the operational challenges they faced.